Page 526 - Krugmans Economics for AP Text Book_Neat
P. 526
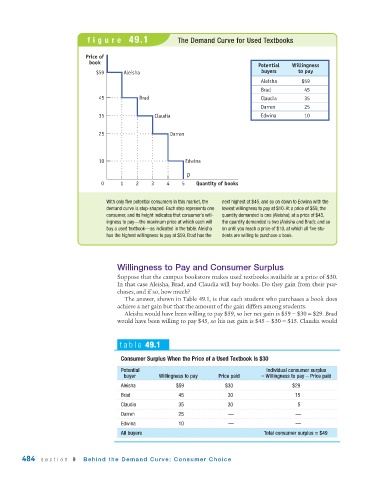
figure 49.1                  The Demand Curve for Used Textbooks


                             Price of
                              book
                                                                                      Potential  Willingness
                                $59       Aleisha                                      buyers      to pay
                                                                                      Aleisha       $59
                                                                                      Brad           45
                                 45            Brad                                   Claudia        35
                                                                                      Darren         25
                                 35                 Claudia                           Edwina         10


                                 25                      Darren


                                 10                           Edwina

                                                              D
                                  0     1     2    3    4    5   Quantity of books


                                    With only five potential consumers in this market, the  next highest at $45, and so on down to Edwina with the
                                    demand curve is step-shaped. Each step represents one  lowest willingness to pay at $10. At a price of $59, the
                                    consumer, and its height indicates that consumer’s will-  quantity demanded is one (Aleisha); at a price of $45,
                                    ingness to pay—the maximum price at which each will  the quantity demanded is two (Aleisha and Brad); and so
                                    buy a used textbook—as indicated in the table. Aleisha  on until you reach a price of $10, at which all five stu-
                                    has the highest willingness to pay at $59, Brad has the  dents are willing to purchase a book.


                                       Willingness to Pay and Consumer Surplus
                                       Suppose that the campus bookstore makes used textbooks available at a price of $30.
                                       In that case Aleisha, Brad, and Claudia will buy books. Do they gain from their pur-
                                       chases, and if so, how much?
                                          The answer, shown in Table 49.1, is that each student who purchases a book does
                                       achieve a net gain but that the amount of the gain differs among students.
                                          Aleisha would have been willing to pay $59, so her net gain is $59 − $30 = $29. Brad
                                       would have been willing to pay $45, so his net gain is $45 − $30 = $15. Claudia would


                                        table 49.1


                                         Consumer Surplus When the Price of a Used Textbook Is $30
                                         Potential                                      Individual consumer surplus
                                          buyer      Willingness to pay  Price paid    = Willingness to pay − Price paid
                                         Aleisha           $59             $30                   $29
                                         Brad              45               30                    15
                                         Claudia           35               30                    5
                                         Darren            25               —                     —
                                         Edwina            10               —                     —
                                         All buyers                                    Total consumer surplus = $49


        484   section 9     Behind the Demand Curve: Consumer Choice

