
Page 733 - Krugmans Economics for AP Text Book_Neat
P. 733
or capital, there is an implicit cost—the opportunity cost—of using it for a given activity
The rental rate of either land or capital
because it could be used for something else, such as renting it out to other firms at the
is the cost, explicit or implicit, of using a
market rental rate. So a profit-maximizing firm employs additional units of land and unit of that asset for a given period of time.
capital until the cost of the last unit employed, explicit or implicit, is equal to the value
of the marginal product of that unit. We call the explicit cost of renting a unit of land Section 13 Factor Markets
or capital for a set period of time its rental rate.
As with labor, due to diminishing returns, the value of the marginal product curve
and therefore the individual firm’s demand curves for land and capital slope downward.
Supply in the Markets for Land and Capital
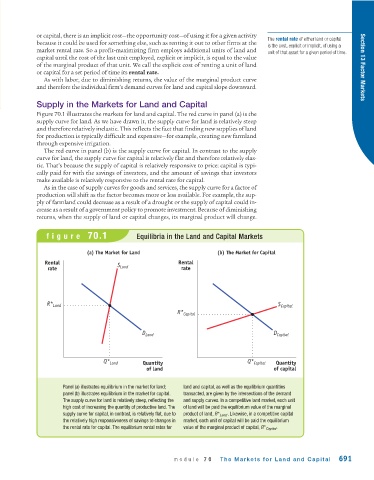
Figure 70.1 illustrates the markets for land and capital. The red curve in panel (a) is the
supply curve for land. As we have drawn it, the supply curve for land is relatively steep
and therefore relatively inelastic. This reflects the fact that finding new supplies of land
for production is typically difficult and expensive—for example, creating new farmland
through expensive irrigation.
The red curve in panel (b) is the supply curve for capital. In contrast to the supply
curve for land, the supply curve for capital is relatively flat and therefore relatively elas-
tic. That’s because the supply of capital is relatively responsive to price: capital is typi-
cally paid for with the savings of investors, and the amount of savings that investors
make available is relatively responsive to the rental rate for capital.
As in the case of supply curves for goods and services, the supply curve for a factor of
production will shift as the factor becomes more or less available. For example, the sup-
ply of farmland could decrease as a result of a drought or the supply of capital could in-
crease as a result of a government policy to promote investment. Because of diminishing
returns, when the supply of land or capital changes, its marginal product will change.
figure 70.1 Equilibria in the Land and Capital Markets
(a) The Market for Land (b) The Market for Capital
Rental S Rental
rate Land rate
R* Land S Capital
R* Capital
D Land D Capital
Q* Land Quantity Q* Capital Quantity
of land of capital
Panel (a) illustrates equilibrium in the market for land; land and capital, as well as the equilibrium quantities
panel (b) illustrates equilibrium in the market for capital. transacted, are given by the intersections of the demand
The supply curve for land is relatively steep, reflecting the and supply curves. In a competitive land market, each unit
high cost of increasing the quantity of productive land. The of land will be paid the equilibrium value of the marginal
supply curve for capital, in contrast, is relatively flat, due to product of land, R* Land . Likewise, in a competitive capital
the relatively high responsiveness of savings to changes in market, each unit of capital will be paid the equilibrium
the rental rate for capital. The equilibrium rental rates for value of the marginal product of capital, R* Capital .
module 70 The Markets for Land and Capital 691