
Page 739 - Krugmans Economics for AP Text Book_Neat
P. 739
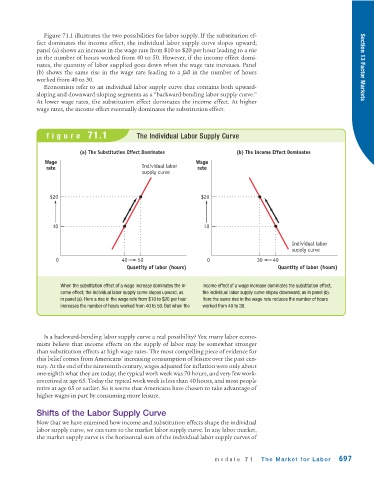
Figure 71.1 illustrates the two possibilities for labor supply. If the substitution ef-
             fect dominates the income effect, the individual labor supply curve slopes upward;
             panel (a) shows an increase in the wage rate from $10 to $20 per hour leading to a rise
             in the number of hours worked from 40 to 50. However, if the income effect domi-
             nates, the quantity of labor supplied goes down when the wage rate increases. Panel                       Section 13 Factor Markets
             (b) shows the same rise in the wage rate leading to a  fall in the number of hours
             worked from 40 to 30.
               Economists refer to an individual labor supply curve that contains both upward-
             sloping and downward-sloping segments as a “backward-bending labor supply curve.”
             At lower wage rates, the substitution effect dominates the income effect. At higher
             wage rates, the income effect eventually dominates the substitution effect.


                figure  71.1                  The Individual Labor Supply Curve


                           (a) The Substitution Effect Dominates              (b) The Income Effect Dominates
                Wage                                             Wage
                rate                            Individual labor  rate
                                                supply curve


                 $20                                               $20


                  10                                                10

                                                                                                 Individual labor
                                                                                                 supply curve

                   0                     40   50                     0               30   40
                                           Quantity of labor (hours)                        Quantity of labor (hours)


                     When the substitution effect of a wage increase dominates the in-  income effect of a wage increase dominates the substitution effect,
                     come effect, the individual labor supply curve slopes upward, as   the individual labor supply curve slopes downward, as in panel (b).
                     in panel (a). Here a rise in the wage rate from $10 to $20 per hour   Here the same rise in the wage rate reduces the number of hours
                     increases the number of hours worked from 40 to 50. But when the  worked from 40 to 30.


               Is a backward-bending labor supply curve a real possibility? Yes: many labor econo-
             mists believe that income effects on the supply of labor may be somewhat stronger
             than substitution effects at high wage rates. The most compelling piece of evidence for
             this belief comes from Americans’ increasing consumption of leisure over the past cen-
             tury. At the end of the nineteenth century, wages adjusted for inflation were only about
             one-eighth what they are today; the typical work week was 70 hours, and very few work-
             ers retired at age 65. Today the typical work week is less than 40 hours, and most people
             retire at age 65 or earlier. So it seems that Americans have chosen to take advantage of
             higher wages in part by consuming more leisure.


             Shifts of the Labor Supply Curve
             Now that we have examined how income and substitution effects shape the individual
             labor supply curve, we can turn to the market labor supply curve. In any labor market,
             the market supply curve is the horizontal sum of the individual labor supply curves of


                                                                       module  71      The Market for Labor     697