
Page 741 - Krugmans Economics for AP Text Book_Neat
P. 741
fyi
The Decline of the Summer Job
Come summertime, resort towns along the summer workforce. Twenty years later that many teenagers no longer feel pressured to
New Jersey shore find themselves facing a re- number had fallen to 63%; and by 2009, it was contribute to household finances by taking a
curring annual problem: a serious shortage of 33%. Data show that young men in particular summer job; that is, the income effect leads to
lifeguards. Traditionally, lifeguard positions, to- have become much less willing to take sum- a reduced labor supply. Another factor points
gether with many other seasonal jobs, have mer jobs. to the substitution effect: increased competition
been filled mainly by high school and college One explanation for the decline in the sum- from immigrants, who are now doing the jobs
students. But in recent years a growing num- mer labor supply is that more students feel they typically done by teenagers (mowing lawns, de-
ber of young Americans have chosen not to should devote their summers to additional livering pizzas), has led to a decline in wages.
take summer jobs. In 1979, 71% of Americans study. But an important factor in the decline is So many teenagers forgo summer work and
between the ages of 16 and 19 were in the increasing household affluence. As a result, consume leisure instead.
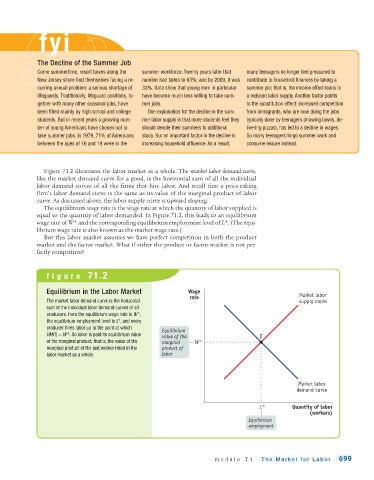
Figure 71.2 illustrates the labor market as a whole. The market labor demand curve,
like the market demand curve for a good, is the horizontal sum of all the individual
labor demand curves of all the firms that hire labor. And recall that a price-taking
firm’s labor demand curve is the same as its value of the marginal product of labor
curve. As discussed above, the labor supply curve is upward sloping.
The equilibrium wage rate is the wage rate at which the quantity of labor supplied is
equal to the quantity of labor demanded. In Figure 71.2, this leads to an equilibrium
wage rate of W* and the corresponding equilibrium employment level of L*. (The equi-
librium wage rate is also known as the market wage rate.)
But this labor market assumes we have perfect competition in both the product
market and the factor market. What if either the product or factor market is not per-
fectly competitive?
figure 71.2
Equilibrium in the Labor Market Wage
rate Market labor
The market labor demand curve is the horizontal supply curve
sum of the individual labor demand curves of all
producers. Here the equilibrium wage rate is W *,
the equilibrium employment level is L*, and every
producer hires labor up to the point at which
Equilibrium
VMPL = W *. So labor is paid its equilibrium value value of the E
of the marginal product, that is, the value of the marginal W*
marginal product of the last worker hired in the product of
labor market as a whole. labor
Market labor
demand curve
L* Quantity of labor
(workers)
Equilibrium
employment
module 71 The Market for Labor 699