Page 761 - Krugmans Economics for AP Text Book_Neat
P. 761
Section 13  Summary


                compensating differentials and by differences in tal-  from employers’ attempts to increase worker perform-
                ent, job experience, and human capital across workers.  ance. Free markets tend to diminish discrimination, but
                Market interference in the forms of unions and collec-  discrimination remains a real source of wage disparity.
                tive action by employers also creates wage disparities.  Discrimination is typically maintained either through
                The efficiency-wage model, which arises from a type of  problems in labor markets or (historically) through in-
                market failure, shows how wage disparities can result  stitutionalization in government policies.


             Key Terms

             Physical capital, p. 680          Marginal productivity theory of income  Monopsonist, p. 701
             Human capital, p. 680               distribution, p. 692             Monopsony, p. 701
             Derived demand, p. 681            Time allocation, p. 695            Cost-minimization rule, p. 708
             Factor distribution of income, p. 681  Leisure, p. 696               Compensating differentials, p. 711
             Value of the marginal product, p. 684  Individual labor supply curve, p. 696  Equilibrium value of the marginal product, p. 712
             Value of the marginal product curve, p. 684  Marginal revenue product of labor, p. 700  Unions, p. 713
             Rental rate, p. 691               Marginal factor cost of labor, p. 700  Efficiency-wage model, p. 714


             Problems


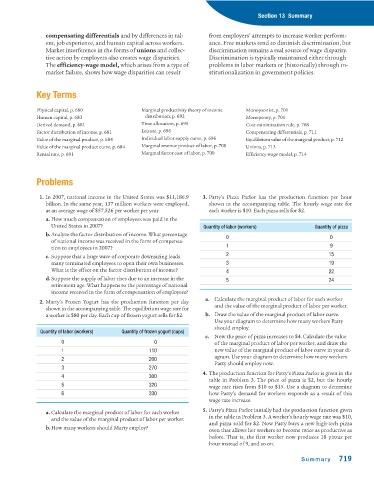
              1. In 2007, national income in the United States was $11,186.9  3. Patty’s Pizza Parlor has the production function per hour
                billion. In the same year, 137 million workers were employed,  shown in the accompanying table. The hourly wage rate for
                at an average wage of $57,526 per worker per year.   each worker is $10. Each pizza sells for $2.
                a. How much compensation of employees was paid in the
                  United States in 2007?                            Quantity of labor (workers)         Quantity of pizza
                b.Analyze the factor distribution of income. What percentage
                                                                           0                                 0
                  of national income was received in the form of compensa-
                  tion to employees in 2007?                               1                                 9
                c. Suppose that a huge wave of corporate downsizing leads  2                                 15
                  many terminated employees to open their own businesses.  3                                 19
                  What is the effect on the factor distribution of income?  4                                22
                d.Suppose the supply of labor rises due to an increase in the  5                             24
                  retirement age. What happens to the percentage of national
                  income received in the form of compensation of employees?
                                                                    a. Calculate the marginal product of labor for each worker
              2. Marty’s Frozen Yogurt has the production function per day
                                                                       and the value of the marginal product of labor per worker.
                shown in the accompanying table. The equilibrium wage rate for
                a worker is $80 per day. Each cup of frozen yogurt sells for $2.  b. Draw the value of the marginal product of labor curve.
                                                                       Use your diagram to determine how many workers Patty
                                                                       should employ.
              Quantity of labor (workers)  Quantity of frozen yogurt (cups)
                                                                    c. Now the price of pizza increases to $4. Calculate the value
                     0                              0                  of the marginal product of labor per worker, and draw the
                     1                            110                  new value of the marginal product of labor curve in your di-
                                                                       agram. Use your diagram to determine how many workers
                     2                            200
                                                                       Patty should employ now.
                     3                            270
                                                                   4. The production function for Patty’s Pizza Parlor is given in the
                     4                            300
                                                                     table in Problem 3. The price of pizza is $2, but the hourly
                     5                            320                wage rate rises from $10 to $15. Use a diagram to determine
                     6                            330                how Patty’s demand for workers responds as a result of this
                                                                     wage rate increase.
                                                                   5. Patty’s Pizza Parlor initially had the production function given
                a. Calculate the marginal product of labor for each worker
                  and the value of the marginal product of labor per worker.  in the table in Problem 3. A worker’s hourly wage rate was $10,
                                                                     and pizza sold for $2. Now Patty buys a new high-tech pizza
                b.How many workers should Marty employ?
                                                                     oven that allows her workers to become twice as productive as
                                                                     before. That is, the first worker now produces 18 pizzas per
                                                                     hour instead of 9, and so on.

                                                                                                    Summary     719

