Page 862 - Krugmans Economics for AP Text Book_Neat
P. 862

S-16    SOLUTIONS TO AP  REVIEW  QUESTIONS


        Tackle the Test:                                      Tackle the Test:
        Free-Response Question                                Free-Response Question
        2.    1) provide financial services to depository     2.   Interest
                institutions—regional Federal Reserve banks         rate, r        MS
              2) supervise and regulate banking institutions—regional
                Federal Reserve banks and the Board of Governors
              3) maintain the stability of the financial system—the
                Board of Governors
                                                                                    E
              4) conduct monetary policy—the Federal Open Market       r E
                Committee
                                                                       r
                                                                       L
                                                                                                           MD
                                                                                   M       M              Quantity
                                                                                            L
                                                                                                          of money
        Module 28
        Check Your Understanding                                   At an interest rate below equilibrium, the quantity of
                                                                   money demanded exceeds the quantity of money supplied.
        1. a. By increasing the opportunity cost of holding money, a  People want to shift more of their wealth out of interest-
              high interest rate reduces the quantity of money demand-  bearing assets such as CDs and hold it as money instead.
              ed. This is a movement up and to the left along the  Because the quantity of interest-bearing nonmoney assets
              money demand curve.                                  demanded is less than the quantity supplied, those trying
           b. A 10% fall in prices reduces the quantity of money   to sell these assets will have to offer a higher interest rate
              demanded at any given interest rate, shifting the money  to attract buyers. As the interest rate rises, the quantity of
              demand curve leftward.                               money demanded decreases. This process continues until
            c. This technological change reduces the quantity of money  the market returns to equilibrium.
              demanded at any given interest rate, so it shifts the
              money demand curve leftward.
           d. Payments in cash require employers to hold more   Module 29
              money, increasing the quantity of money demanded at  Check Your Understanding
              any given interest rate. So it shifts the money demand
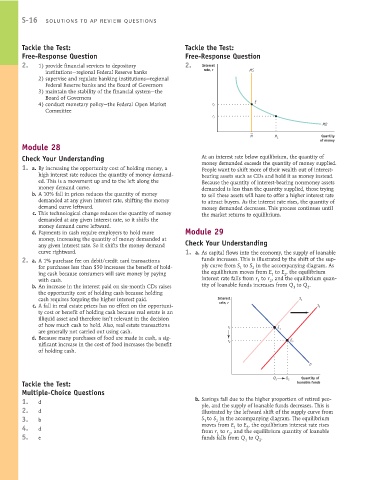
              curve rightward.                                1. a. As capital flows into the economy, the supply of loanable
        2. a. A 1% purchase fee on debit/credit card transactions   funds increases. This is illustrated by the shift of the sup-
              for purchases less than $50 increases the benefit of hold-  ply curve from S to S in the accompanying diagram. As
                                                                                    2
                                                                               1
              ing cash because consumers will save money by paying  the equilibrium moves from E to E , the equilibrium
                                                                                              2
                                                                                          1
              with cash.                                           interest rate falls from r to r , and the equilibrium quan-
                                                                                     1
                                                                                         2
           b. An increase in the interest paid on six-month CDs raises  tity of loanable funds increases from Q to Q .
                                                                                                 1
                                                                                                      2
              the opportunity cost of holding cash because holding
              cash requires forgoing the higher interest paid.          Interest                   S 1
                                                                         rate, r
            c. A fall in real estate prices has no effect on the opportuni-                              S 2
              ty cost or benefit of holding cash because real estate is an
              illiquid asset and therefore isn’t relevant in the decision
              of how much cash to hold. Also, real estate transactions
                                                                            r 1             E 1
              are generally not carried out using cash.
           d. Because many purchases of food are made in cash, a sig-
                                                                            r 2                 E 2
              nificant increase in the cost of food increases the benefit
              of holding cash.
                                                                                                      D
                                                                                          Q 1  Q 2  Quantity of
        Tackle the Test:                                                                          loanable funds
        Multiple-Choice Questions
        1.    d                                                  b. Savings fall due to the higher proportion of retired peo-
        2.    d                                                    ple, and the supply of loanable funds decreases. This is
                                                                   illustrated by the leftward shift of the supply curve from
        3.    b                                                    S to S in the accompanying diagram. The equilibrium
                                                                        2
                                                                    1
        4.    d                                                    moves from E to E , the equilibrium interest rate rises
                                                                             1
                                                                                  2
                                                                   from r to r , and the equilibrium quantity of loanable
                                                                            2
                                                                        1
        5.    e                                                    funds falls from Q to Q .
                                                                                 1    2
   857   858   859   860   861   862   863   864   865   866   867