
Page 857 - Krugmans Economics for AP Text Book_Neat
P. 857
S-11
SOLUTIONS TO AP REVIEW QUESTIONS
e. This is a movement down along the aggregate demand increase in nominal wages. As a result, the SRAS curve
curve. As the aggregate price level falls, the real value of will shift leftward because production costs are now high-
assets rises. This is the wealth effect of a change in the er, leading to a lower quantity of aggregate output sup-
aggregate price level: as the value of assets rises, people plied at any given aggregate price level.
will increase their consumption plans. This leads to high- 2. You would need to know what happened to the aggregate
er consumer spending. So it is a movement along the price level. If the increase in the quantity of aggregate
aggregate demand curve.
output supplied was due to a movement along the SRAS
f. This is a shift of the aggregate demand curve. A rise in curve, the aggregate price level would have increased at
the real value of assets in the economy due to a surge in the same time as the quantity of aggregate output sup-
real estate values raises consumer spending at any given plied increased. If the increase in the quantity of aggre-
aggregate price level. So the aggregate demand curve gate output supplied was due to a rightward shift of the
shifts to the right.
LRAS curve, the aggregate price level might not rise.
Tackle the Test: Alternatively, you could make the determination by
Multiple-Choice Questions observing what happened to aggregate output in the long
run. If it fell back to its initial level in the long run, then
1. d the temporary increase in aggregate output was due to a
2. c movement along the SRAS curve. If it stayed at the higher
3. c level in the long run, the increase in aggregate output
was due to a rightward shift of the LRAS curve.
4. a Tackle the Test:
5. a Multiple-Choice Questions
Tackle the Test: 1. e
Free-Response Question 2. a
2. The two effects that cause the aggregate demand curve to 3. c
have a downward slope are the wealth effect and the 4. d
interest rate effect of a change in the aggregate price level. 5.
The wealth effect: When the price level increases, the e
purchasing power of money decreases, causing consumers Tackle the Test:
to scale back on spending. Because consumer spending is Free-Response Questions
a component of aggregate demand, increases in the aggre-
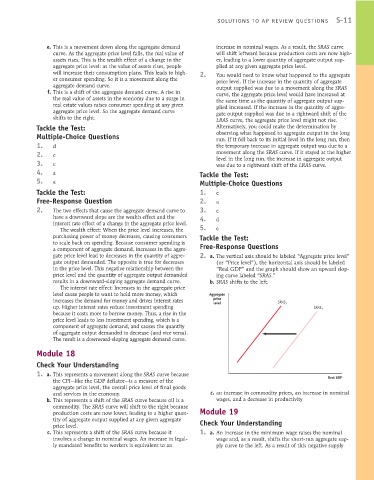
gate price level lead to decreases in the quantity of aggre- 2. a. The vertical axis should be labeled “Aggregate price level”
gate output demanded. The opposite is true for decreases (or “Price level”), the horizontal axis should be labeled
in the price level. This negative relationship between the “Real GDP” and the graph should show an upward slop-
price level and the quantity of aggregate output demanded ing curve labeled “SRAS.”
results in a downward-sloping aggregate demand curve. b. SRAS shifts to the left.
The interest rate effect: Increases in the aggregate price
level cause people to want to hold more money, which Aggregate
increases the demand for money and drives interest rates price SRAS
level 2
up. Higher interest rates reduce investment spending SRAS 1
because it costs more to borrow money. Thus, a rise in the
price level leads to less investment spending, which is a
component of aggregate demand, and causes the quantity
of aggregate output demanded to decrease (and vice versa).
The result is a downward-sloping aggregate demand curve.
Module 18
Check Your Understanding
1. a. This represents a movement along the SRAS curve because
Real GDP
the CPI—like the GDP deflator—is a measure of the
aggregate price level, the overall price level of final goods
and services in the economy. c. an increase in commodity prices, an increase in nominal
b. This represents a shift of the SRAS curve because oil is a wages, and a decrease in productivity
commodity. The SRAS curve will shift to the right because Module 19
production costs are now lower, leading to a higher quan-
tity of aggregate output supplied at any given aggregate Check Your Understanding
price level.
c. This represents a shift of the SRAS curve because it 1. a. An increase in the minimum wage raises the nominal
involves a change in nominal wages. An increase in legal- wage and, as a result, shifts the short - run aggregate sup-
ly mandated benefits to workers is equivalent to an ply curve to the left. As a result of this negative supply