Page 439 - Geosystems An Introduction to Physical Geography 4th Canadian Edition
P. 439
Chapter 13 Tectonics, Earthquakes, and Volcanism 403
   Bay Bridge
Site of freeway collapse
   San Francisco
Oakland
San Francisco Bay
   Santa Cruz
18.5 km
Epicentre
6.0 km
North American plate
Loma Prieta
Uplift 36 cm
Direction of plate motion
 (a)
 Pacific plate
North American plate
Animation
P– and S– Waves, Seismology
 Pacific plate
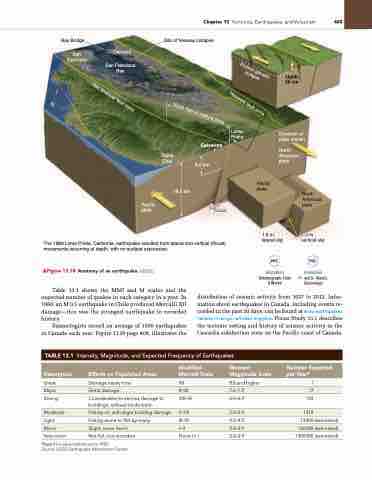
 The 1989 Loma Prieta, California, earthquake resulted from lateral and vertical (thrust) movements occurring at depth, with no surface expression.
▲Figure 13.18 anatomy of an earthquake. [USgS.]
Table 13.1 shows the MMI and M scales and the expected number of quakes in each category in a year. In 1960, an M 9.5 earthquake in Chile produced Mercalli XII damage—this was the strongest earthquake in recorded history.
Seismologists record an average of 1500 earthquakes in Canada each year. Figure 13.19 page 408, illustrates the
Animation
Seismograph, How It Works
distribution of seismic activity from 1627 to 2012. Infor- mation about earthquakes in Canada, including events re- corded in the past 30 days, can be found at www.earthquakes canada.nrcan.gc.ca/index-eng.php. Focus Study 13.1 describes the tectonic setting and history of seismic activity in the Cascadia subduction zone on the Pacific coast of Canada.
 taBLE 13.1 Intensity, Magnitude, and Expected Frequency of Earthquakes
 Description
Effects on Populated areas
Modified Mercalli Scale
Moment Magnitude Scale
Number Expected per Year*
great
 Damage nearly total
 XII
 8.0 and higher
 1
 Major
 great damage
 X–XI
 7.0–7.9
 17
 Strong
Considerable-to-serious damage to buildings; railroad tracks bent
VIII–IX
6.0–6.9
134
 Moderate
 Felt-by-all, with slight building damage
 V–VII
 5.0–5.9
 1319
 Light
  Felt-by-some to felt-by-many
  III–IV
  4.0–4.9
  13 000 (estimated)
 Minor
Slight, some feel it
I–II
3.0–3.9
130 000 (estimated)
 Very minor
  Not felt, but recorded
  None to I
  2.0–2.9
  1 300 000 (estimated)
  *Based on observations since 1990.
Source: USgS Earthquake Information Center.
Former ground surface
San Andreas fault zone
Hayward fault zone
North half of rupture zone


