Page 497 - Geosystems An Introduction to Physical Geography 4th Canadian Edition
P. 497
Chapter 15 River Systems 461
      Lag time between storm peak and stream discharge peak:
• Before urbanization • After urbanization
         Precipitation
event Passage of time
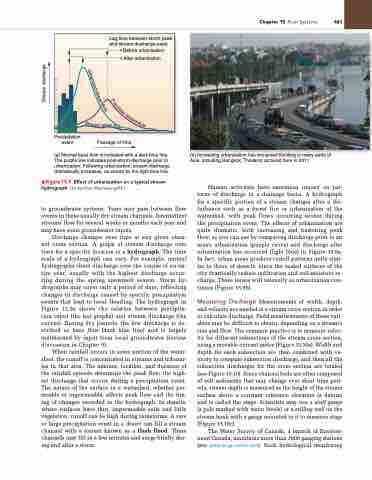
(a) Normal base flow is indicated with a dark blue line. The purple line indicates post-storm discharge prior to urbanization. Following urbanization, stream discharge dramatically increases, as shown by the light blue line.
▲Figure 15.9 effect of urbanization on a typical stream hydrograph. [(b) Apichart Weerawong/AP.]
to groundwater systems. Years may pass between flow events in these usually dry stream channels. Intermittent streams flow for several weeks or months each year and may have some groundwater inputs.
Discharge changes over time at any given chan- nel cross section. A graph of stream discharge over time for a specific location is a hydrograph. The time scale of a hydrograph can vary. For example, annual hydrographs show discharge over the course of an en- tire year, usually with the highest discharge occur- ring during the spring snowmelt season. Storm hy- drographs may cover only a period of days, reflecting changes in discharge caused by specific precipitation events that lead to local flooding. The hydrograph in Figure 15.9a shows the relation between precipita- tion input (the bar graphs) and stream discharge (the curves). During dry periods, the low discharge is de- scribed as base flow (dark blue line) and is largely maintained by input from local groundwater (review discussion in Chapter 9).
When rainfall occurs in some portion of the water- shed, the runoff is concentrated in streams and tributar- ies in that area. The amount, location, and duration of the rainfall episode determine the peak flow, the high- est discharge that occurs during a precipitation event. The nature of the surface in a watershed, whether per- meable or impermeable, affects peak flow and the tim- ing of changes recorded in the hydrograph. In deserts, where surfaces have thin, impermeable soils and little vegetation, runoff can be high during rainstorms. A rare or large precipitation event in a desert can fill a stream channel with a torrent known as a flash flood. These channels may fill in a few minutes and surge briefly dur- ing and after a storm.
(b) Increasing urbanization has worsened flooding in many parts of Asia, including Bangkok, Thailand, pictured here in 2011.
Human activities have enormous impact on pat- terns of discharge in a drainage basin. A hydrograph for a specific portion of a stream changes after a dis- turbance such as a forest fire or urbanization of the watershed, with peak flows occurring sooner during the precipitation event. The effects of urbanization are quite dramatic, both increasing and hastening peak flow, as you can see by comparing discharge prior to an area’s urbanization (purple curve) and discharge after urbanization has occurred (light blue) in Figure 15.9a. In fact, urban areas produce runoff patterns quite simi- lar to those of deserts, since the sealed surfaces of the city drastically reduce infiltration and soil-moisture re- charge. These issues will intensify as urbanization con- tinues (Figure 15.9b).
Measuring Discharge Measurements of width, depth, and velocity are needed at a stream cross section in order to calculate discharge. Field measurements of these vari- ables may be difficult to obtain, depending on a stream’s size and flow. The common practice is to measure veloc- ity for different subsections of the stream cross section, using a movable current metre (Figure 15.10a). Width and depth for each subsection are then combined with ve- locity to compute subsection discharge, and then all the subsection discharges for the cross section are totaled (see Figure 15.10). Since channel beds are often composed of soft sediments that may change over short time peri- ods, stream depth is measured as the height of the stream surface above a constant reference elevation (a datum) and is called the stage. Scientists may use a staff gauge (a pole marked with water levels) or a stilling well on the stream bank with a gauge mounted in it to measure stage (Figure 15.10c).
The Water Survey of Canada, a branch of Environ- ment Canada, maintains more than 3000 gauging stations (see www.ec.gc.ca/rhc-wsc). Such hydrological monitoring
   Stream discharge
U
r
be
ani
z
d
s
t
r
e
a
P
m
r
e
f
l
u
o
r
w
b
a
n
s
t
r
e
a
a
b
m
f
l
S
o
t
r
e
s
a
e
w
m
f
l
o
w


