Page 706 - Geosystems An Introduction to Physical Geography 4th Canadian Edition
P. 706
 A Maps in This Text
and Topographic Maps
Maps Used in This Text
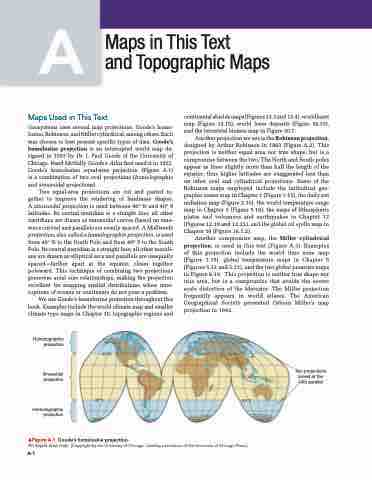
Geosystems uses several map projections: Goode’s homo- losine, Robinson, and Miller cylindrical, among others. Each was chosen to best present specific types of data. Goode’s homolosine projection is an interrupted world map de- signed in 1923 by Dr. J. Paul Goode of the University of Chicago. Rand McNally Goode’s Atlas first used it in 1925. Goode’s homolosine equal-area projection (Figure A.1) is a combination of two oval projections (homolographic and sinusoidal projections).
Two equal-area projections are cut and pasted to- gether to improve the rendering of landmass shapes. A sinusoidal projection is used between 40° N and 40° S latitudes. Its central meridian is a straight line; all other meridians are drawn as sinusoidal curves (based on sine- wave curves) and parallels are evenly spaced. A Mollweide projection, also called a homolographic projection, is used from 40° N to the North Pole and from 40° S to the South Pole. Its central meridian is a straight line; all other meridi- ans are drawn as elliptical arcs and parallels are unequally spaced—farther apart at the equator, closer together poleward. This technique of combining two projections preserves areal size relationships, making the projection excellent for mapping spatial distributions when inter- ruptions of oceans or continents do not pose a problem.
We use Goode’s homolosine projection throughout this book. Examples include the world climate map and smaller climate type maps in Chapter 10, topographic regions and
continental shields maps (Figures 13.3 and 13.4), world karst map (Figure 14.15), world loess deposits (Figure 16.33), and the terrestrial biomes map in Figure 20.7.
Another projection we use is the Robinson projection, designed by Arthur Robinson in 1963 (Figure A.2). This projection is neither equal area nor true shape, but is a compromise between the two. The North and South poles appear as lines slightly more than half the length of the equator; thus higher latitudes are exaggerated less than on other oval and cylindrical projections. Some of the Robinson maps employed include the latitudinal geo- graphic zones map in Chapter 1 (Figure 1.15), the daily net radiation map (Figure 2.10), the world temperature range map in Chapter 5 (Figure 5.16), the maps of lithospheric plates and volcanoes and earthquakes in Chapter 12 (Figures 12.19 and 12.21), and the global oil spills map in Chapter 16 (Figure 16.1.2).
Another compromise map, the Miller cylindrical projection, is used in this text (Figure A.3). Examples of this projection include the world time zone map (Figure 1.19), global temperature maps in Chapter 5 (Figures 5.12 and 5.13), and the two global pressure maps in Figure 6.10. This projection is neither true shape nor true area, but is a compromise that avoids the severe scale distortion of the Mercator. The Miller projection frequently appears in world atlases. The American Geographical Society presented Osborn Miller’s map projection in 1942.
Homolographic projection
Sinusoidal projection
Homolographic projection
40oN
40oS
40oN
40oS
Two projections joined at the 40th parallel
▲Figure A.1 Goode’s homolosine projection.
An equal-area map. [Copyright by the University of Chicago. Used by permission of the University of Chicago Press.]
A-1


