Page 707 - Geosystems An Introduction to Physical Geography 4th Canadian Edition
P. 707
 A p p e C n h d a i p x t A e r : AM a M p a s p i n s i T n h T i s h i T s e T x e t x a t n a d n d T o T p o p o o g g r a r a p p h h i c i c M M a a p p s s A - 2 2
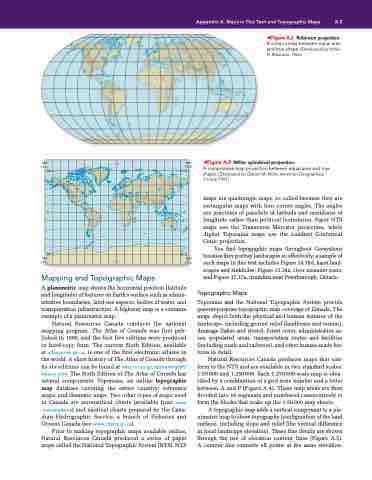
 ◀Figure A.2 Robinson projection. A compromise between equal area and true shape. [Developed by Arthur H. Robinson, 1963.]
                     180° I.D.L.
0°
80° 180°
180° ◀Figure A.3 Miller cylindrical projection.
I.D.L. A compromise map projection between equal area and true
0°
80°N         80°N
shape. [Developed by Osborn M. Miller, American Geographical Society, 1942.]
maps are quadrangle maps, so called because they are rectangular maps with four corner angles. The angles are junctions of parallels of latitude and meridians of longitude rather than political boundaries. Paper NTS maps use the Transverse Mercator projection, while digital Toporama maps use the Lambert Conformal Conic projection.
You find topographic maps throughout Geosystems because they portray landscapes so effectively; a sample of such maps in this text includes Figure 14.18d, karst land- scapes and sinkholes; Figure 15.24a, river meander scars; and Figure 17.17a, drumlins near Peterborough, Ontario.
Topographic Maps
Toporama and the National Topographic System provide general-purpose topographic map coverage of Canada. The maps depict both the physical and human features of the landscape, including ground relief (landforms and terrain), drainage (lakes and rivers), forest cover, administrative ar- eas, populated areas, transportation routes and facilities (including roads and railways), and other human-made fea- tures in detail.
Natural Resources Canada produces maps that con- form to the NTS and are available in two standard scales: 1:50000 and 1:250000. Each 1:250000-scale map is iden- tified by a combination of a grid zone number and a letter between A and P (Figure A.4). These map areas are then divided into 16 segments and numbered consecutively to form the blocks that make up the 1:50 000 map sheets.
A topographic map adds a vertical component to a pla- nimetric map to show topography (configuration of the land surface), including slope and relief (the vertical difference in local landscape elevation). These fine details are shown through the use of elevation contour lines (Figure A.5). A contour line connects all points at the same elevation.
          S
0° I.D.L. Mapping and Topographic Maps
A planimetric map shows the horizontal position (latitude and longitude) of features on Earth’s surface such as admin- istrative boundaries, land-use aspects, bodies of water, and transportation infrastructure. A highway map is a common example of a planimetric map.
Natural Resources Canada conducts the national mapping program. The Atlas of Canada was first pub- lished in 1906, and the first five editions were produced in hard-copy form. The current Sixth Edition, available at atlas.nrcan.gc.ca, is one of the first electronic atlases in the world. A short history of The Atlas of Canada through its six editions can be found at atlas.nrcan.gc.ca/site/english/ history.html. The Sixth Edition of The Atlas of Canada has several components: Toporama, an online topographic map database covering the entire country; reference maps; and thematic maps. Two other types of maps used in Canada are aeronautical charts (available from www .navcanada.ca) and nautical charts prepared by the Cana- dian Hydrographic Service, a branch of Fisheries and Oceans Canada (see www.charts.gc.ca).
Prior to making topographic maps available online, Natural Resources Canada produced a series of paper maps called the National Topographic System (NTS). NTS
I.D.L.
0°
80°S 180°


