
Page 243 - The Principle of Economics
P. 243
CHAPTER 12 THE DESIGN OF THE TAX SYSTEM 247
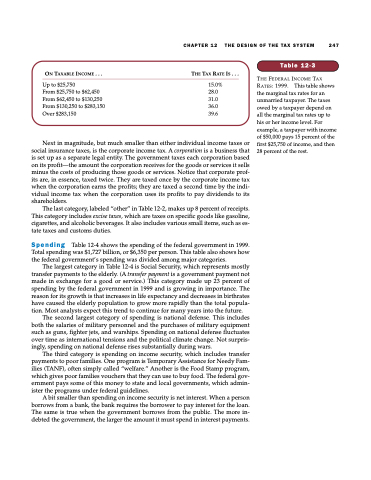
ON TAXABLE INCOME ...
Up to $25,750
From $25,750 to $62,450 From $62,450 to $130,250 From $130,250 to $283,150 Over $283,150
THE TAX RATE IS ...
15.0% 28.0 31.0 36.0 39.6
Table 12-3
THE FEDERAL INCOME TAX RATES: 1999. This table shows the marginal tax rates for an unmarried taxpayer. The taxes owed by a taxpayer depend on all the marginal tax rates up to his or her income level. For example, a taxpayer with income of $50,000 pays 15 percent of the first $25,750 of income, and then 28 percent of the rest.
Next in magnitude, but much smaller than either individual income taxes or social insurance taxes, is the corporate income tax. A corporation is a business that is set up as a separate legal entity. The government taxes each corporation based on its profit—the amount the corporation receives for the goods or services it sells minus the costs of producing those goods or services. Notice that corporate prof- its are, in essence, taxed twice. They are taxed once by the corporate income tax when the corporation earns the profits; they are taxed a second time by the indi- vidual income tax when the corporation uses its profits to pay dividends to its shareholders.
The last category, labeled “other” in Table 12-2, makes up 8 percent of receipts. This category includes excise taxes, which are taxes on specific goods like gasoline, cigarettes, and alcoholic beverages. It also includes various small items, such as es- tate taxes and customs duties.
Spending Table 12-4 shows the spending of the federal government in 1999. Total spending was $1,727 billion, or $6,350 per person. This table also shows how the federal government’s spending was divided among major categories.
The largest category in Table 12-4 is Social Security, which represents mostly transfer payments to the elderly. (A transfer payment is a government payment not made in exchange for a good or service.) This category made up 23 percent of spending by the federal government in 1999 and is growing in importance. The reason for its growth is that increases in life expectancy and decreases in birthrates have caused the elderly population to grow more rapidly than the total popula- tion. Most analysts expect this trend to continue for many years into the future.
The second largest category of spending is national defense. This includes both the salaries of military personnel and the purchases of military equipment such as guns, fighter jets, and warships. Spending on national defense fluctuates over time as international tensions and the political climate change. Not surpris- ingly, spending on national defense rises substantially during wars.
The third category is spending on income security, which includes transfer payments to poor families. One program is Temporary Assistance for Needy Fam- ilies (TANF), often simply called “welfare.” Another is the Food Stamp program, which gives poor families vouchers that they can use to buy food. The federal gov- ernment pays some of this money to state and local governments, which admin- ister the programs under federal guidelines.
A bit smaller than spending on income security is net interest. When a person borrows from a bank, the bank requires the borrower to pay interest for the loan. The same is true when the government borrows from the public. The more in- debted the government, the larger the amount it must spend in interest payments.
