
Page 245 - The Principle of Economics
P. 245
CHAPTER 12 THE DESIGN OF THE TAX SYSTEM 249
TAX
Sales taxes
Property taxes
Individual income taxes Corporate income taxes From federal government Other
AMOUNT
(IN BILLIONS)
$ 249 209 147 32 235 351
AMOUNT
PER PERSON
PERCENT OF
OF RECEIPTS
20% 17 12
3 19 29
100%
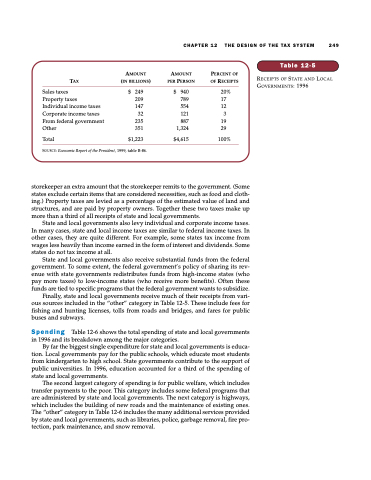
Table 12-5
RECEIPTS OF STATE AND LOCAL GOVERNMENTS: 1996
Total $1,223 SOURCE: Economic Report of the President, 1999, table B-86.
1,324 $4,615
$
940
789
554
121
887
storekeeper an extra amount that the storekeeper remits to the government. (Some states exclude certain items that are considered necessities, such as food and cloth- ing.) Property taxes are levied as a percentage of the estimated value of land and structures, and are paid by property owners. Together these two taxes make up more than a third of all receipts of state and local governments.
State and local governments also levy individual and corporate income taxes. In many cases, state and local income taxes are similar to federal income taxes. In other cases, they are quite different. For example, some states tax income from wages less heavily than income earned in the form of interest and dividends. Some states do not tax income at all.
State and local governments also receive substantial funds from the federal government. To some extent, the federal government’s policy of sharing its rev- enue with state governments redistributes funds from high-income states (who pay more taxes) to low-income states (who receive more benefits). Often these funds are tied to specific programs that the federal government wants to subsidize.
Finally, state and local governments receive much of their receipts from vari- ous sources included in the “other” category in Table 12-5. These include fees for fishing and hunting licenses, tolls from roads and bridges, and fares for public buses and subways.
Spending Table 12-6 shows the total spending of state and local governments in 1996 and its breakdown among the major categories.
By far the biggest single expenditure for state and local governments is educa- tion. Local governments pay for the public schools, which educate most students from kindergarten to high school. State governments contribute to the support of public universities. In 1996, education accounted for a third of the spending of state and local governments.
The second largest category of spending is for public welfare, which includes transfer payments to the poor. This category includes some federal programs that are administered by state and local governments. The next category is highways, which includes the building of new roads and the maintenance of existing ones. The “other” category in Table 12-6 includes the many additional services provided by state and local governments, such as libraries, police, garbage removal, fire pro- tection, park maintenance, and snow removal.
