
Page 244 - The Principle of Economics
P. 244
248 PART FOUR THE ECONOMICS OF THE PUBLIC SECTOR
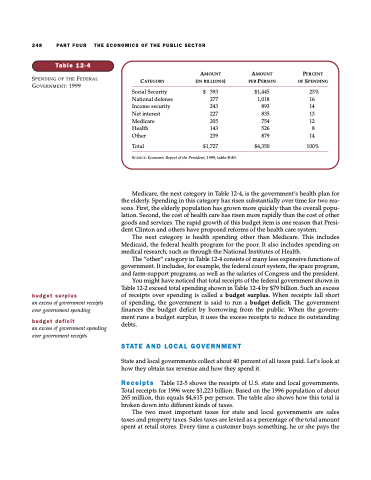
Table 12-4
SPENDING OF THE FEDERAL GOVERNMENT: 1999
CATEGORY
Social Security National defense Income security Net interest Medicare
Health Other
AMOUNT
(IN BILLIONS)
AMOUNT
PER PERSON
$1,445 1,018 893 835 754 526 879
$6,350
PERCENT
OF SPENDING
23% 16 14 13 12
8 14
100%
Total $1,727
SOURCE: Economic Report of the President, 1999, table B-80.
$
393
277
243
227
205
143
239
budget surplus
an excess of government receipts over government spending
budget deficit
an excess of government spending over government receipts
Medicare, the next category in Table 12-4, is the government’s health plan for the elderly. Spending in this category has risen substantially over time for two rea- sons. First, the elderly population has grown more quickly than the overall popu- lation. Second, the cost of health care has risen more rapidly than the cost of other goods and services. The rapid growth of this budget item is one reason that Presi- dent Clinton and others have proposed reforms of the health care system.
The next category is health spending other than Medicare. This includes Medicaid, the federal health program for the poor. It also includes spending on medical research, such as through the National Institutes of Health.
The “other” category in Table 12-4 consists of many less expensive functions of government. It includes, for example, the federal court system, the space program, and farm-support programs, as well as the salaries of Congress and the president.
You might have noticed that total receipts of the federal government shown in Table 12-2 exceed total spending shown in Table 12-4 by $79 billion. Such an excess of receipts over spending is called a budget surplus. When receipts fall short of spending, the government is said to run a budget deficit. The government finances the budget deficit by borrowing from the public. When the govern- ment runs a budget surplus, it uses the excess receipts to reduce its outstanding debts.
STATE AND LOCAL GOVERNMENT
State and local governments collect about 40 percent of all taxes paid. Let’s look at how they obtain tax revenue and how they spend it.
Receipts Table 12-5 shows the receipts of U.S. state and local governments. Total receipts for 1996 were $1,223 billion. Based on the 1996 population of about 265 million, this equals $4,615 per person. The table also shows how this total is broken down into different kinds of taxes.
The two most important taxes for state and local governments are sales taxes and property taxes. Sales taxes are levied as a percentage of the total amount spent at retail stores. Every time a customer buys something, he or she pays the
