
Page 19 - 06 Cotton SA September 2015
P. 19
Outlook on Textiles
On the international demand side, polyester fibre is the main competitor for cotton lint. Cotton’s share
of the global textile fibre end-use market declined from about 68 per cent in 1960 to approximately 28
per cent in 2013, and is expected to continue to decline during 2014 and 2015. Furthermore, polyester
fibre prices declined during 2013/14 and remained more competitive than cotton prices.
he US fibre and yarn producers have begun to pass
on costs through to customers because they were hit
hard in the past months by cost increases, but price
increases are still lagging behind the escalating cost
Tof materials. The recent skyrocketing of petroleum
prices have been a punch in the gut for many manufacturers,
particularly man-made fibre producers. Overall polyester
staple fibre prices are up about 14 US cents per pound from
a year ago. One spinner in the USA have made the following
comment: “Our customers have disappeared. We had to look
hard for opportunities. To be successful you have to focus
on lead times and customer service, almost to a point where
price (also vital) is secondary.” The rising cost of energy also
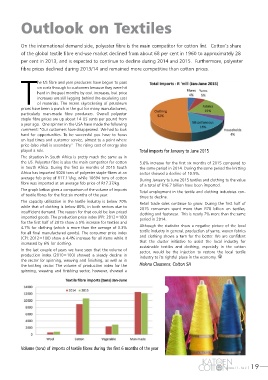
played a role. Total imports for January to June 2015
The situation in South Africa is pretty much the same as in
the US. Polyester fibre is also the main competitor for cotton 5.6% increase for the first six months of 2015 compared to
in South Africa. During the first six months of 2015 South the same period in 2014. During the same period the knitting
Africa has imported 5026 tons of polyester staple fibres at an sector showed a decline of 10.5%.
average fob price of R17.11/kg, while 10694 tons of cotton During January to June 2015 textiles and clothing to the value
fibre was imported at an average fob price of R17.37/kg. of a total of R16.7 billion have been imported.
The graph below gives a comparison of the volume of imports Total employment in the textile and clothing industries con-
of textile fibres for the first six months of the year. tinue to decline.
The capacity utilisation in the textile industry is below 70% Retail trade sales continue to grow. During the first half of
while that of clothing is below 80%, in both sectors due to 2015 consumers spent more than R78 billion on textiles,
insufficient demand. The reason for that could be low priced clothing and footwear. This is nearly 7% more than the same
imported goods. The production price index (PPI: 2012=100) period in 2014.
for the first half of 2015 show a 5% increase for textiles and
4.7% for clothing (which is more than the average of 3.3% Although the statistics show a negative picture of the lo cal
for all final manufactured goods). The consumer price index textile industry in general, production of yarns, woven fabrics
(CPI: 2012=100) show a 4.4% increase for all items while it and clothing shows a turn for the better. We are confident
increased by 6% for clothing. that the cluster initiative to assist the local industry for
sustainable textiles and clothing, especially in the cotton
In the last couple of years we have seen that the volume of sector, would be the injection to restore the local textile
production index (2010=100) showed a steady decline in industry to its rightful place in the economy.
the sector for spinning, weaving and finishing, as well as in
the knitting sector. The volume of production index for the Helena Claassens, Cotton SA
spinning, weaving and finishing sector, however, showed a
Volume (tons) of imports of textile fibres during the first 6 months of the year
Volume 17 – No 2 | 19