
Page 17 - The EDGE Summer 2025
P. 17
Optimizing School Boundaries and Building Utilization with
Confidence
CONTINUED FROM PAGE 15
and diverse perspectives from the community. A
well-planned approach includes:
1. Engaging Stakeholders: Involve parents,
staff, and community members early in the
process.
2. Providing Clear Data: Use GIS-generated
visuals to communicate the rationale behind
decisions.
3. Addressing Concerns: Be prepared to respond
to questions about equity, transportation, and
• Comprehensive Data Access: Current student program access.
enrollment, special program participation, and
parcel data can be overlaid with school zones Transparent communication, backed by data,
to provide actionable insights. can help reduce resistance and foster a shared
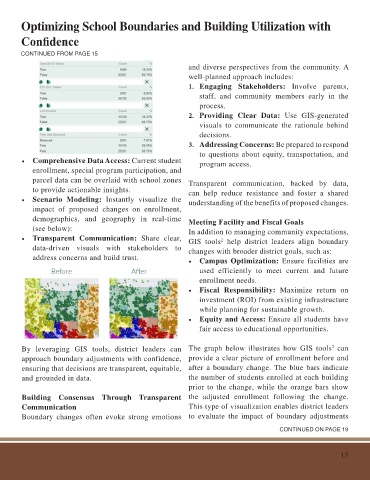
• Scenario Modeling: Instantly visualize the understanding of the benefits of proposed changes.
impact of proposed changes on enrollment,
demographics, and geography in real-time Meeting Facility and Fiscal Goals
(see below): In addition to managing community expectations,
• Transparent Communication: Share clear, GIS tools help district leaders align boundary
2
data-driven visuals with stakeholders to changes with broader district goals, such as:
address concerns and build trust. • Campus Optimization: Ensure facilities are
used efficiently to meet current and future
enrollment needs.
• Fiscal Responsibility: Maximize return on
investment (ROI) from existing infrastructure
while planning for sustainable growth.
• Equity and Access: Ensure all students have
fair access to educational opportunities.
By leveraging GIS tools, district leaders can The graph below illustrates how GIS tools can
2
approach boundary adjustments with confidence, provide a clear picture of enrollment before and
ensuring that decisions are transparent, equitable, after a boundary change. The blue bars indicate
and grounded in data. the number of students enrolled at each building
prior to the change, while the orange bars show
Building Consensus Through Transparent the adjusted enrollment following the change.
Communication This type of visualization enables district leaders
Boundary changes often evoke strong emotions to evaluate the impact of boundary adjustments
CONTINUED ON PAGE 19
17