
Page 6 - demo
P. 6
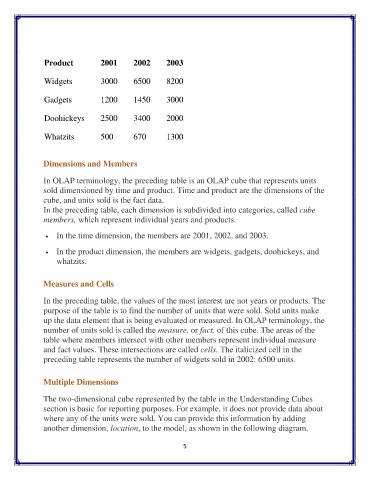
Product 2001 2002 2003
Widgets 3000 6500 8200
Gadgets 1200 1450 3000
Doohickeys 2500 3400 2000
Whatzits 500 670 1300
Dimensions and Members
In OLAP terminology, the preceding table is an OLAP cube that represents units
sold dimensioned by time and product. Time and product are the dimensions of the
cube, and units sold is the fact data.
In the preceding table, each dimension is subdivided into categories, called cube
members, which represent individual years and products.
In the time dimension, the members are 2001, 2002, and 2003.
In the product dimension, the members are widgets, gadgets, doohickeys, and
whatzits.
Measures and Cells
In the preceding table, the values of the most interest are not years or products. The
purpose of the table is to find the number of units that were sold. Sold units make
up the data element that is being evaluated or measured. In OLAP terminology, the
number of units sold is called the measure, or fact, of this cube. The areas of the
table where members intersect with other members represent individual measure
and fact values. These intersections are called cells. The italicized cell in the
preceding table represents the number of widgets sold in 2002: 6500 units.
Multiple Dimensions
The two-dimensional cube represented by the table in the Understanding Cubes
section is basic for reporting purposes. For example, it does not provide data about
where any of the units were sold. You can provide this information by adding
another dimension, location, to the model, as shown in the following diagram.
5