
Page 7 - demo
P. 7
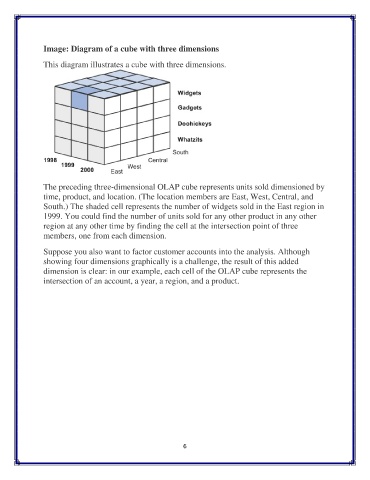
Image: Diagram of a cube with three dimensions

               This diagram illustrates a cube with three dimensions.


               The preceding three-dimensional OLAP cube represents units sold dimensioned by
               time, product, and location. (The location members are East, West, Central, and
               South.) The shaded cell represents the number of widgets sold in the East region in
               1999. You could find the number of units sold for any other product in any other
               region at any other time by finding the cell at the intersection point of three
               members, one from each dimension.

               Suppose you also want to factor customer accounts into the analysis. Although
               showing four dimensions graphically is a challenge, the result of this added
               dimension is clear: in our example, each cell of the OLAP cube represents the
               intersection of an account, a year, a region, and a product.


                                                              6