
Page 85 - NIB Annual Report 12-13 | 13-14
P. 85
TURKS AND CAICOS ISLANDS NATIONAL INSURANCE BOARD
Notes to Financial Statements, continued Year ended March 31, 2013
25. Financial instruments, continued
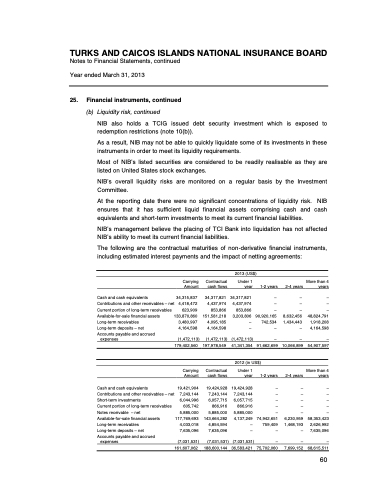
(b) Liquidity risk, continued
NIB also holds a TCIG issued debt security investment which is exposed to redemption restrictions (note 10(b)).
As a result, NIB may not be able to quickly liquidate some of its investments in these instruments in order to meet its liquidity requirements.
Most of NIB’s listed securities are considered to be readily realisable as they are listed on United States stock exchanges.
NIB’s overall liquidity risks are monitored on a regular basis by the Investment Committee.
At the reporting date there were no significant concentrations of liquidity risk. NIB ensures that it has sufficient liquid financial assets comprising cash and cash equivalents and short-term investments to meet its current financial liabilities.
NIB’s management believe the placing of TCI Bank into liquidation has not affected NIB’s ability to meet its current financial liabilities.
The following are the contractual maturities of non-derivative financial instruments, including estimated interest payments and the impact of netting agreements:
2013 (US$)
Carrying Amount
Contractual cash flows
34,317,821 4,437,974 853,866 151,581,218 4,095,185 4,164,598
Under 1 year
34,317,821 4,437,974 853,866 3,203,806 – –
1-2 years
– – –
90,920,165 742,534 –
2-4 years
– – –
8,632,456 1,434,443 –
– 10,066,899
2-4 years
– – – – –
6,230,959 1,468,193 –
More than 4 years
– – –
48,824,791 1,918,208 4,164,598
– 54,907,597
More than 4 years
– – – – –
58,353,423 2,626,992 7,635,096
Cash and cash equivalents
Contributions and other receivables – net
Current portion of long-term receivables Available-for-sale financial assets Long-term receivables
Long-term deposits – net
Accounts payable and accrued expenses
34,315,837 4,418,472 623,909 133,870,860 3,480,997 4,164,598
(1,472,113) (1,472,113)
179,402,560 197,978,549 41,341,354 91,662,699
(1,472,113) 2012 (in US$)
–
Cash and cash equivalents
Contributions and other receivables – net Short-term investments
Current portion of long-term receivables Notes receivable – net
Available-for-sale financial assets Long-term receivables
Long-term deposits – net
Accounts payable and accrued expenses
Carrying Amount
19,421,904 7,243,144 6,044,996
605,742 5,885,000 117,769,693 4,033,018 7,635,096
Contractual cash flows
19,424,928 7,243,144 6,057,715
866,916 5,885,000 143,664,282 4,854,594 7,635,096
Under 1 year
19,424,928 7,243,144 6,057,715
866,916 5,885,000 4,137,249
– –
1-2 years
– – – – –
74,942,651 759,409 –
(7,031,531) (7,031,531) (7,031,531)
161,607,062 188,600,144 36,583,421 75,702,060 7,699,152 68,615,511
–
–
–
2013 & 2014 ANNUAL REPORT | 81 60
