
Page 124 - Demo
P. 124
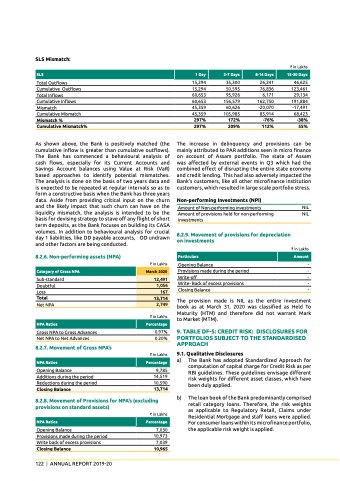
sLs Mismatch:
total outflows
Cumulative outflows
total Inflows
Cumulative Inflows
Mismatch
Cumulative Mismatch
Mismatch % cumulative Mismatch%
As shown above, the Bank is positively matched (the cumulative inflow is greater than cumulative outflows). The Bank has commenced a behavioural analysis of cash flows, especially for its Current Accounts and Savings Account balances using Value at Risk (VaR) based approaches to identify potential mismatches. The analysis is done on the basis of two years data and is expected to be repeated at regular intervals so as to form a constructive basis when the Bank has three years data. Aside from providing critical input on the churn and the likely impact that such churn can have on the liquidity mismatch, the analysis is intended to be the basis for devising strategy to stave off any flight of short term deposits, as the Bank focuses on building its CASA volumes. In addition to behavioural analysis for crucial
15,294
15,294
60,653
60,653
45,359
45,359
297%
297%
35,300
50,595
95,926
156,579
60,626
105,985
172%
209%
26,241
76,836
6,171
162,750
-20,070
85,914
-76%
112%
` in Lakhs
46,625
123,461
29,134
191,884
-17,491
68,423
-38%
55%
 sLs
 1 day
2-7 days
  8-14 days
 15-30 days
               day 1 liabilities, like DD payable accounts, and other factors are being conducted.
8.2.6. non-performing assets (nPa)
Sub-standard Doubtful Loss
total
Net NPA
Gross NPA to Gross Advances Net NPA to Net Advances
8.2.7. Movement of gross nPa’s
Opening Balance
Additions during the period Reductions during the period closing balance
OD undrawn
` in Lakhs
` in Lakhs
0.97% 0.20%
` in Lakhs
9,785 14,519 10,590 13,714
The increase in delinquency and provisions can be mainly attributed to pAR additions seen in micro finance on account of Assam portfolio. The state of Assam was affected by external events in Q3 which had the combined effect of disrupting the entire state economy and credit lending. This had also adversely impacted the Bank’s customers, like all other microfinance institution customers, which resulted in large scale portfolio stress.
non-performing investments (nPi)
Amount of Non-performing investments NIL Amount of provisions held for non-performing NIL investments
8.2.9. Movement of provisions for depreciation on investments
` in Lakhs
Opening Balance - Provisions made during the period - Write-off - Write- Back of excess provisions - Closing Balance -
The provision made is NIL as the entire investment book as at March 31, 2020 was classified as Held to Maturity (HTM) and therefore did not warrant Mark to Market (MTM).
9. Table DF-5: creDiT riSk: DiScloSureS For PortfoLios subJect to the standardised aPProach
9.1. Qualitative disclosures
Particulars
 amount
        category of gross nPa
March 2020
    12,491
   1,056
   167
    13,714
  2,749
  nPa ratios
 Percentage
     nPa ratios
 Percentage
         8.2.8. Movement of Provisions for nPa’s (excluding provisions on standard assets)
a)
b)
The Bank has adopted Standardized Approach for computation of capital charge for Credit Risk as per RBI guidelines. these guidelines envisage different risk weights for different asset classes, which have been duly applied.
The loan book of the Bank predominantly comprised retail category loans. Therefore, the risk weights as applicable to Regulatory Retail, Claims under Residential Mortgage and staff loans were applied. For consumer loans within its microfinance portfolio, the applicable risk weight is applied.
nPa ratios
 Percentage
 Opening Balance
Provisions made during the period Write back of excess provisions closing balance
` in Lakhs
7,030 10,973 7,039 10,965
         122 | AnnuAl RepoRt 2019-20
