
Page 65 - EM SOCIAL NOTES 10TH CLASS PSR DIGITAL BOOKS
P. 65
9. RAMPUR A VILLAGE ECONOMY
INFORMATION SKILL (AS -3)
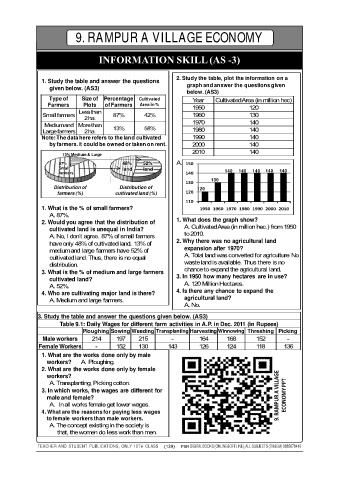
2. Study the table, plot the information on a
1. Study the table and answer the questions
graph and answer the questions given
given below. (AS3)
below. (AS3)
Type of Size of Percentage Cultivated Year Cultivated Area (in million hec)
Farmers Plots of Farmers Area in %
1950 120
Less than
Small farmers 87% 42% 1960 130
2 ha.
1970 140
Medium and More than 13% 58%
Large farmers 2 ha. 1980 140
Note: The data here refers to the land cultivated 1990 140
by farmers. it could be owned or taken on rent. 2000 140
2010 140
13% Medium & Large
87% 48% 52% A. 150
Small land land
farmers 140 140 140 140 140 140
130 130
Distribution of Distribution of 120
farmers (%) cultivated land (%) 120
110
1. What is the % of small farmers? 1950 1960 1970 1980 1990 2000 2010
A. 87%.
2. Would you agree that the distribution of 1. What does the graph show?
A. Cultivated Area (in million hec.) from 1950
cultivated land is unequal in India?
A. No, I don’t agree. 87% of small farmers to 2010.
2. Why there was no agricultural land
have only 48% of cultivated land. 13% of
medium and large farmers have 52% of expansion after 1970?
A. Total land was converted for agriculture No
cultivated land. Thus, there is no equal
distribution. waste land is available. Thus there is no
3. What is the % of medium and large farmers chance to expand the agricultural land.
3. In 1950 how many hectares are in use?
cultivated land?
A. 120 Million Hectares.
A. 52%.
4. Who are cultivating major land is there? 4. Is there any chance to expand the
A. Medium and large farmers. agricultural land?
A. No.
3. Study the table and answer the questions given below. (AS3)
Table 9.1: Daily Wages for different farm activities in A.P. in Dec. 2011 (in Rupees)
Ploughing Sowing Weeding Transplanting Harvesting Winnowing Threshing Picking
Male workers 214 197 215 - 164 168 152 -
Female Workers - 152 130 143 126 124 118 136
1. What are the works done only by male
workers? A. Ploughing.
2. What are the works done only by female
workers?
A. Transplanting, Picking cotton.
3. In which works, the wages are different for
male and female? 9. RAMPUR A VILLAGE ECONOMY PPT
A. In all works female get lower wages.
4. What are the reasons for paying less wages
to female workers than male workers.
A. The concept existing in the society is
that, the women do less work than men.
TEACHER AND STUDENT PUBLICATIONS, ONLY 10TH CLASS (139) PSR DIGITAL BOOKS (ONLINE&OFFLINE), ALL SUBJECTS (TM&EM) 9885678410