
Page 33 - Housing Report - January 2025
P. 33
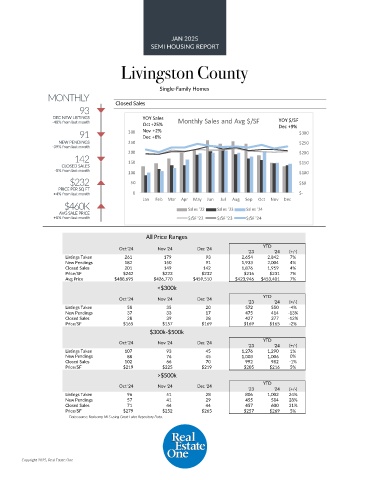
JAN 2025
                                                   SEMI HOUSING REPORT

                                         Livingston County


                                                      Single-Family Homes
                 MONTHLY
                           93          Closed Sales

                   DEC NEW LISTINGS             YOY Sales                                    YOY $/SF
                  -48% from last month          Oct +25%    Monthly Sales and Avg $/SF       Dec +9%
                           91              300  Nov +2%                                              $300
                                                Dec +6%
                    NEW PENDINGS           250                                                       $250
                  -39% from last month
                                           200                                                       $200
                          142
                     CLOSED SALES          150                                                       $150
                   -5% from last month     100                                                       $100
                        $232                50                                                       $50
                    PRICE PER SQ FT
                   +4% from last month       0                                                       $-
                                                Jan  Feb  Mar  Apr  May  Jun  Jul  Aug  Sep  Oct  Nov  Dec
                      $460K
                     AVG SALE PRICE                            Sales '22  Sales '23  Sales '24
                   +8% from last month                         $/SF '22  $/SF '23  $/SF '24


                                                 All Price Ranges

                                        Oct '24      Nov '24      Dec '24               YTD
                                                                                   '23      '24  (+/-)
                       Listings Taken                    261                    179                       93             2,654             2,842  7%
                       New Pendings                    182                    150                       91             1,933             2,004  4%
                       Closed Sales                    201                    149                    142             1,876             1,959  4%
                       Price/SF           $242         $223         $232          $216    $231   7%
                       Avg Price       $488,695     $426,770     $459,510      $423,946  $453,401  7%
                                                     <$300k

                                        Oct '24      Nov '24      Dec '24               YTD
                                                                                   '23      '24  (+/-)
                       Listings Taken                       58                       35                       20                 572                550  -4%
                       New Pendings                       37                       33                       17                 475                414  -13%
                       Closed Sales                       28                       39                       28                 427                377  -12%
                       Price/SF           $165         $157         $169          $169    $165   -2%
                                                   $300k-$500k
                                        Oct '24      Nov '24      Dec '24               YTD
                                                                                   '23      '24  (+/-)
                       Listings Taken                    107                       93                       45             1,276             1,290  1%
                       New Pendings                       88                       76                       45             1,003             1,006  0%
                       Closed Sales                    102                       66                       70                 992                982  -1%
                       Price/SF           $219         $225         $219          $205    $216   5%
                                                     >$500k
                                                                                        YTD
                                        Oct '24      Nov '24      Dec '24
                                                                                   '23      '24  (+/-)
                       Listings Taken                       96                       51                       28                 806             1,002  24%
                       New Pendings                       57                       41                       29                 455                584  28%
                       Closed Sales                       71                       44                       44                 457                600  31%
                       Price/SF           $279         $252         $265          $257    $269   5%
                        Data source: Realcomp MLS using Great Lakes Repository Data.


        Copyright 2025, Real Estate One