
Page 28 - Housing Report - January 2025
P. 28
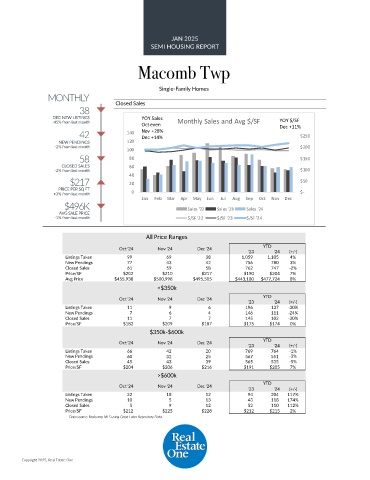
JAN 2025
                                                   SEMI HOUSING REPORT

                                               Macomb Twp


                                                      Single-Family Homes
                 MONTHLY
                           38          Closed Sales

                   DEC NEW LISTINGS             YOY Sales                                     YOY $/SF
                  -45% from last month          Oct even    Monthly Sales and Avg $/SF        Dec +11%
                           42              140  Nov +28%                                             $250
                                                Dec +14%
                    NEW PENDINGS           120
                   -2% from last month                                                               $200
                                           100
                           58               80                                                       $150
                     CLOSED SALES           60
                   -2% from last month      40                                                       $100
                        $217                20                                                       $50
                    PRICE PER SQ FT
                   +3% from last month       0                                                       $-
                                                Jan  Feb  Mar  Apr  May  Jun  Jul  Aug  Sep  Oct  Nov  Dec
                      $496K                                    Sales '22  Sales '23  Sales '24
                     AVG SALE PRICE
                   -1% from last month                         $/SF '22  $/SF '23  $/SF '24


                                                 All Price Ranges

                                        Oct '24      Nov '24      Dec '24               YTD
                                                                                   '23      '24  (+/-)
                       Listings Taken                       99                       69                       38             1,059             1,105  4%
                       New Pendings                       77                       43                       42                 756                780  3%
                       Closed Sales                       61                       59                       58                 762                747  -2%
                       Price/SF           $202         $210         $217          $190    $204   7%
                       Avg Price       $455,938     $500,998     $495,505      $443,180  $477,724  8%
                                                     <$350k

                                        Oct '24      Nov '24      Dec '24               YTD
                                                                                   '23      '24  (+/-)
                       Listings Taken                       11                         9                         6                 196                137  -30%
                       New Pendings                         7                         6                         4                 146                111  -24%
                       Closed Sales                       11                         7                         7                 145                102  -30%
                       Price/SF           $182         $209         $187          $175    $174   0%
                                                   $350k-$600k
                                        Oct '24      Nov '24      Dec '24               YTD
                                                                                   '23      '24  (+/-)
                       Listings Taken                       66                       42                       20                 769                764  -1%
                       New Pendings                       60                       32                       25                 567                551  -3%
                       Closed Sales                       45                       43                       39                 565                535  -5%
                       Price/SF           $204         $206         $216          $191    $205   7%
                                                     >$600k
                                                                                        YTD
                                        Oct '24      Nov '24      Dec '24
                                                                                   '23      '24  (+/-)
                       Listings Taken                       22                       18                       12                   94                204  117%
                       New Pendings                       10                         5                       13                   43                118  174%
                       Closed Sales                         5                         9                       12                   52                110  112%
                       Price/SF           $212         $225         $228          $212    $215   2%
                        Data source: Realcomp MLS using Great Lakes Repository Data.


        Copyright 2025, Real Estate One