
Page 26 - Housing Report - January 2025
P. 26
JAN 2025
SEMI HOUSING REPORT
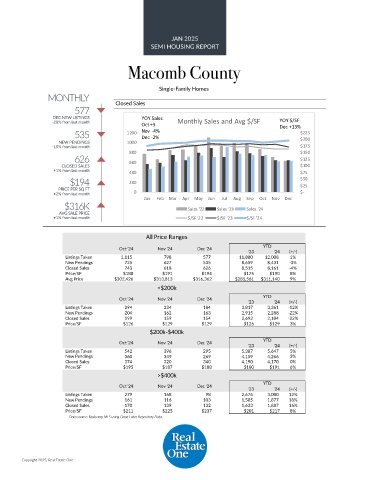
Macomb County
Single-Family Homes
MONTHLY
577 Closed Sales
DEC NEW LISTINGS YOY Sales YOY $/SF
-28% from last month Oct +3 Monthly Sales and Avg $/SF Dec +13%
535 1200 Nov -4% $225
Dec -2%
NEW PENDINGS 1000 $200
-15% from last month $175
800 $150
626 $125
CLOSED SALES 600 $100
+1% from last month 400 $75
$194 200 $50
PRICE PER SQ FT $25
+2% from last month 0 $-
Jan Feb Mar Apr May Jun Jul Aug Sep Oct Nov Dec
$316K Sales '22 Sales '23 Sales '24
AVG SALE PRICE
+1% from last month $/SF '22 $/SF '23 $/SF '24
All Price Ranges
Oct '24 Nov '24 Dec '24 YTD
'23 '24 (+/-)
Listings Taken 1,115 798 577 11,880 12,008 1%
New Pendings 725 627 535 8,659 8,431 -3%
Closed Sales 743 618 626 8,515 8,161 -4%
Price/SF $188 $191 $194 $175 $190 8%
Avg Price $302,426 $313,813 $316,362 $285,561 $311,140 9%
<$200k
Oct '24 Nov '24 Dec '24 YTD
'23 '24 (+/-)
Listings Taken 294 234 184 3,817 3,361 -12%
New Pendings 204 162 163 2,915 2,288 -22%
Closed Sales 199 159 154 2,692 2,104 -22%
Price/SF $126 $129 $129 $126 $129 3%
$200k-$400k
Oct '24 Nov '24 Dec '24 YTD
'23 '24 (+/-)
Listings Taken 542 396 295 5,387 5,647 5%
New Pendings 360 349 269 4,159 4,266 3%
Closed Sales 374 320 340 4,190 4,170 0%
Price/SF $195 $187 $188 $180 $191 6%
>$400k
YTD
Oct '24 Nov '24 Dec '24
'23 '24 (+/-)
Listings Taken 279 168 98 2,676 3,000 12%
New Pendings 161 116 103 1,585 1,877 18%
Closed Sales 170 139 132 1,633 1,887 16%
Price/SF $211 $225 $237 $201 $217 8%
Data source: Realcomp MLS using Great Lakes Repository Data.
Copyright 2025, Real Estate One