
Page 23 - Housing Report - January 2025
P. 23
JAN 2025
SEMI HOUSING REPORT
Dearborn/Deaborn Heights
Single-Family Homes
MONTHLY
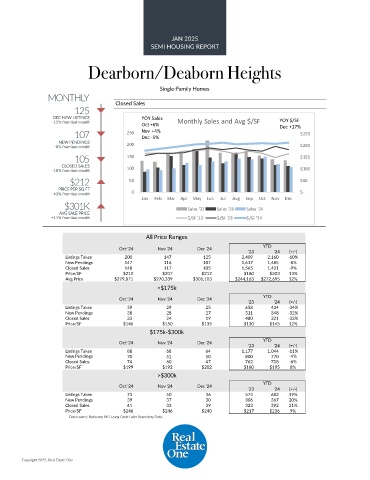
125 Closed Sales
DEC NEW LISTINGS YOY Sales YOY $/SF
-15% from last month Oct +6% Monthly Sales and Avg $/SF Dec +17%
107 250 Nov +4% $250
Dec -5%
NEW PENDINGS 200
-8% from last month $200
105 150 $150
CLOSED SALES 100
-10% from last month $100
$212 50 $50
PRICE PER SQ FT
+3% from last month 0 $-
Jan Feb Mar Apr May Jun Jul Aug Sep Oct Nov Dec
$301K Sales '22 Sales '23 Sales '24
AVG SALE PRICE
+11% from last month $/SF '22 $/SF '23 $/SF '24
All Price Ranges
Oct '24 Nov '24 Dec '24 YTD
'23 '24 (+/-)
Listings Taken 200 147 125 2,409 2,160 -10%
New Pendings 147 116 107 1,617 1,485 -8%
Closed Sales 148 117 105 1,565 1,431 -9%
Price/SF $210 $207 $212 $180 $203 13%
Avg Price $279,871 $270,339 $301,103 $244,163 $272,695 12%
<$175k
Oct '24 Nov '24 Dec '24 YTD
'23 '24 (+/-)
Listings Taken 39 29 25 658 434 -34%
New Pendings 38 28 27 511 348 -32%
Closed Sales 33 24 19 480 321 -33%
Price/SF $146 $150 $135 $130 $145 12%
$175k-$300k
Oct '24 Nov '24 Dec '24 YTD
'23 '24 (+/-)
Listings Taken 88 68 64 1,177 1,044 -11%
New Pendings 70 51 50 800 770 -4%
Closed Sales 74 60 47 762 718 -6%
Price/SF $199 $192 $202 $180 $195 8%
>$300k
YTD
Oct '24 Nov '24 Dec '24
'23 '24 (+/-)
Listings Taken 73 50 36 574 682 19%
New Pendings 39 37 30 306 367 20%
Closed Sales 41 33 39 323 392 21%
Price/SF $246 $246 $240 $217 $236 9%
Data source: Realcomp MLS using Great Lakes Repository Data.
Copyright 2025, Real Estate One