
Page 19 - Housing Report - January 2025
P. 19
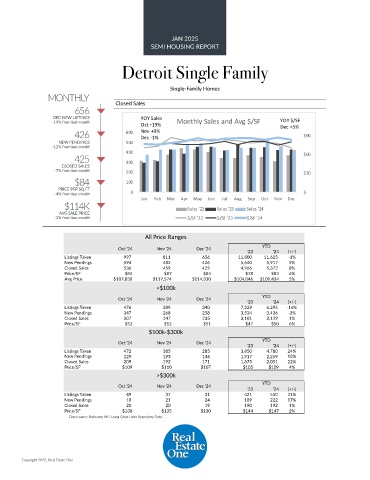
JAN 2025
                                                   SEMI HOUSING REPORT

                                         Detroit Single Family


                                                         Single-Family Homes
                 MONTHLY
                          656          Closed Sales

                   DEC NEW LISTINGS             YOY Sales                                     YOY $/SF
                  -19% from last month          Oct +19%    Monthly Sales and Avg $/SF        Dec +5%
                          426              600  Nov +9%                                               $90
                                                Dec -1%
                    NEW PENDINGS           500
                  -12% from last month
                                           400                                                        $60
                          425
                     CLOSED SALES          300
                   -7% from last month     200                                                        $30
                          $84              100
                    PRICE PER SQ FT
                   -4% from last month      0                                                         $-
                                                Jan  Feb  Mar  Apr  May  Jun  Jul  Aug  Sep  Oct  Nov  Dec
                      $114K                                    Sales '22  Sales '23  Sales '24
                     AVG SALE PRICE
                   -3% from last month                         $/SF '22  $/SF '23  $/SF '24


                                                 All Price Ranges

                                        Oct '24      Nov '24      Dec '24               YTD
                                                                                   '23     '24  (+/-)
                      Listings Taken                    997                    811                    656           11,800           11,625  -1%
                      New Pendings                    594                    482                    426             5,640             5,917  5%
                      Closed Sales                    536                    459                    425             4,966             5,372  8%
                      Price/SF            $84          $87          $84           $78      $83   6%
                      Avg Price        $107,838     $117,574     $114,310      $104,046  $109,434  5%
                                                     <$100k

                                        Oct '24      Nov '24      Dec '24               YTD
                                                                                   '23     '24  (+/-)
                      Listings Taken                    476                    389                    340             7,529             6,295  -16%
                      New Pendings                    347                    268                    258             3,534             3,436  -3%
                      Closed Sales                    307                    247                    235             3,101             3,129  1%
                      Price/SF            $52          $52          $51           $47      $50   6%
                                                  $100k-$300k
                                        Oct '24      Nov '24      Dec '24               YTD
                                                                                   '23     '24  (+/-)
                      Listings Taken                    472                    385                    285             3,850             4,780  24%
                      New Pendings                    229                    193                    144             1,917             2,259  18%
                      Closed Sales                    209                    192                    171             1,675             2,051  22%
                      Price/SF           $109         $110         $107          $105     $109   4%
                                                     >$300k
                                                                                        YTD
                                        Oct '24      Nov '24      Dec '24
                                                                                   '23     '24  (+/-)
                      Listings Taken                       49                       37                       31                 421                550  31%
                      New Pendings                       18                       21                       24                 189                222  17%
                      Closed Sales                       20                       20                       19                 190                192  1%
                      Price/SF           $138         $135         $130          $144     $147   2%
                        Data source: Realcomp MLS using Great Lakes Repository Data.


        Copyright 2025, Real Estate One