
Page 14 - Housing Report - January 2025
P. 14
JAN 2025
SEMI HOUSING REPORT
Waterford
Single-Family Homes
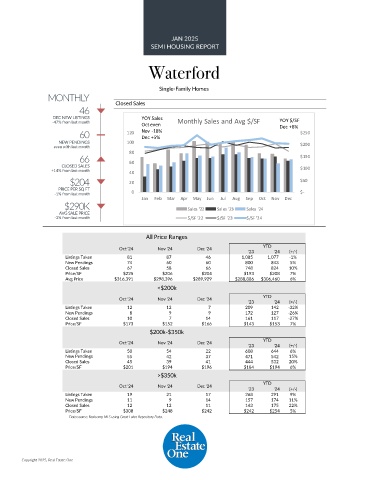
MONTHLY
46 Closed Sales
DEC NEW LISTINGS YOY Sales YOY $/SF
-47% from last month Oct even Monthly Sales and Avg $/SF Dec +8%
60 120 Nov -18% $250
Dec +5%
NEW PENDINGS 100 $200
even with last month
80
66 $150
CLOSED SALES 60 $100
+14% from last month 40
$204 20 $50
PRICE PER SQ FT
-1% from last month 0 $-
Jan Feb Mar Apr May Jun Jul Aug Sep Oct Nov Dec
$290K Sales '22 Sales '23 Sales '24
AVG SALE PRICE
-3% from last month $/SF '22 $/SF '23 $/SF '24
All Price Ranges
Oct '24 Nov '24 Dec '24 YTD
'23 '24 (+/-)
Listings Taken 81 87 46 1,085 1,077 -1%
New Pendings 74 60 60 800 843 5%
Closed Sales 67 58 66 748 824 10%
Price/SF $225 $206 $204 $193 $208 7%
Avg Price $316,391 $298,396 $289,929 $288,886 $306,460 6%
<$200k
Oct '24 Nov '24 Dec '24 YTD
'23 '24 (+/-)
Listings Taken 12 12 7 209 142 -32%
New Pendings 8 9 9 172 127 -26%
Closed Sales 10 7 14 161 117 -27%
Price/SF $173 $152 $166 $143 $153 7%
$200k-$350k
Oct '24 Nov '24 Dec '24 YTD
'23 '24 (+/-)
Listings Taken 50 54 22 608 644 6%
New Pendings 55 42 37 471 542 15%
Closed Sales 45 39 41 444 532 20%
Price/SF $201 $194 $196 $184 $194 6%
>$350k
YTD
Oct '24 Nov '24 Dec '24
'23 '24 (+/-)
Listings Taken 19 21 17 268 291 9%
New Pendings 11 9 14 157 174 11%
Closed Sales 12 12 11 143 175 22%
Price/SF $308 $248 $242 $242 $254 5%
Data source: Realcomp MLS using Great Lakes Repository Data.
Copyright 2025, Real Estate One