
Page 9 - Housing Report - January 2025
P. 9
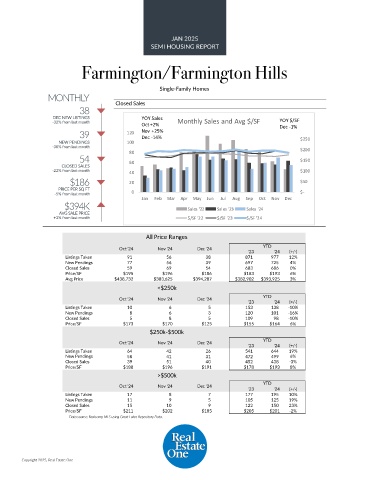
JAN 2025
                                                   SEMI HOUSING REPORT

                            Farmington/Farmington Hills


                                                      Single-Family Homes
                 MONTHLY
                           38          Closed Sales

                   DEC NEW LISTINGS             YOY Sales                                     YOY $/SF
                  -32% from last month          Oct +2%     Monthly Sales and Avg $/SF        Dec -1%
                           39              120  Nov +25%
                                                Dec -14%
                    NEW PENDINGS           100                                                       $250
                  -30% from last month                                                               $200
                                            80
                           54                                                                        $150
                     CLOSED SALES           60
                  -22% from last month      40                                                       $100
                        $186                20                                                       $50
                    PRICE PER SQ FT
                   -5% from last month       0                                                       $-
                                                Jan  Feb  Mar  Apr  May  Jun  Jul  Aug  Sep  Oct  Nov  Dec
                      $394K                                    Sales '22  Sales '23  Sales '24
                     AVG SALE PRICE
                   +3% from last month                         $/SF '22  $/SF '23  $/SF '24


                                                 All Price Ranges

                                        Oct '24      Nov '24      Dec '24               YTD
                                                                                   '23      '24  (+/-)
                       Listings Taken                       91                       56                       38                 871                977  12%
                       New Pendings                       77                       56                       39                 697                725  4%
                       Closed Sales                       59                       69                       54                 683                686  0%
                       Price/SF           $195         $196         $186          $183    $193   6%
                       Avg Price       $438,732     $383,625     $394,287      $382,902  $393,925  3%
                                                     <$250k

                                        Oct '24      Nov '24      Dec '24               YTD
                                                                                   '23      '24  (+/-)
                       Listings Taken                       10                         6                         5                 153                138  -10%
                       New Pendings                         8                         6                         3                 120                101  -16%
                       Closed Sales                         5                         8                         5                 109                   98  -10%
                       Price/SF           $173         $170         $125          $155    $164   6%
                                                   $250k-$500k
                                        Oct '24      Nov '24      Dec '24               YTD
                                                                                   '23      '24  (+/-)
                       Listings Taken                       64                       42                       26                 541                644  19%
                       New Pendings                       58                       41                       31                 472                499  6%
                       Closed Sales                       39                       51                       40                 452                438  -3%
                       Price/SF           $188         $196         $191          $178    $193   8%
                                                     >$500k
                                                                                        YTD
                                        Oct '24      Nov '24      Dec '24
                                                                                   '23      '24  (+/-)
                       Listings Taken                       17                         8                         7                 177                195  10%
                       New Pendings                       11                         9                         5                 105                125  19%
                       Closed Sales                       15                       10                         9                 122                150  23%
                       Price/SF           $211         $202         $185          $205    $201   -2%
                        Data source: Realcomp MLS using Great Lakes Repository Data.


        Copyright 2025, Real Estate One