
Page 12 - Housing Report - January 2025
P. 12
JAN 2025
SEMI HOUSING REPORT
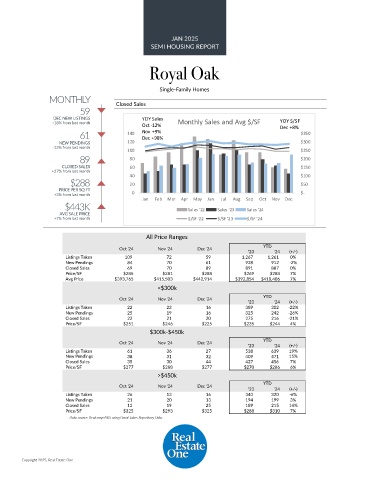
Royal Oak
Single-Family Homes
MONTHLY Closed Sales
59
DEC NEW LISTINGS YOY Sales YOY $/SF
-18% from last month Oct -12% Monthly Sales and Avg $/SF Dec +8%
61 140 Nov +9% $350
Dec +98%
NEW PENDINGS 120 $300
-13% from last month
100 $250
89 80 $200
CLOSED SALES 60 $150
+27% from last month
40 $100
$288 20 $50
PRICE PER SQ FT
+3% from last month 0 $-
Jan Feb Mar Apr May Jun Jul Aug Sep Oct Nov Dec
$443K Sales '22 Sales '23 Sales '24
AVG SALE PRICE
+7% from last month $/SF '22 $/SF '23 $/SF '24
All Price Ranges
Oct '24 Nov '24 Dec '24 YTD
'23 '24 (+/-)
Listings Taken 109 72 59 1,267 1,261 0%
New Pendings 84 70 61 928 912 -2%
Closed Sales 69 70 89 891 887 0%
Price/SF $285 $281 $288 $269 $288 7%
Avg Price $393,765 $415,503 $442,914 $392,854 $418,406 7%
<$300k
Oct '24 Nov '24 Dec '24 YTD
'23 '24 (+/-)
Listings Taken 22 23 16 389 302 -22%
New Pendings 25 19 16 325 242 -26%
Closed Sales 22 21 20 275 216 -21%
Price/SF $251 $246 $225 $235 $244 4%
$300k-$450k
Oct '24 Nov '24 Dec '24 YTD
'23 '24 (+/-)
Listings Taken 61 36 27 538 639 19%
New Pendings 38 31 32 409 471 15%
Closed Sales 35 30 44 427 456 7%
Price/SF $277 $288 $277 $270 $286 6%
>$450k
YTD
Oct '24 Nov '24 Dec '24
'23 '24 (+/-)
Listings Taken 26 13 16 340 320 -6%
New Pendings 21 20 13 194 199 3%
Closed Sales 12 19 25 189 215 14%
Price/SF $325 $293 $325 $288 $310 7%
Data source: Realcomp MLS using Great Lakes Repository Data.
Copyright 2025, Real Estate One