
Page 7 - Housing Report - January 2025
P. 7
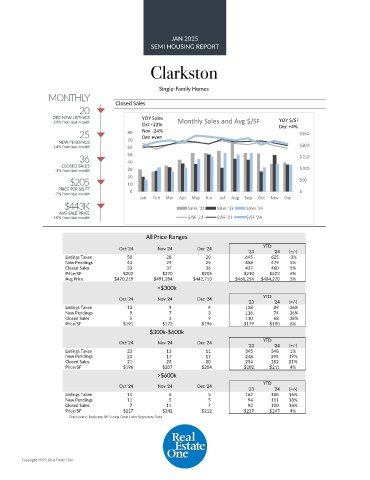
JAN 2025
                                                   SEMI HOUSING REPORT

                                                   Clarkston


                                                      Single-Family Homes
                 MONTHLY
                           20          Closed Sales

                   DEC NEW LISTINGS             YOY Sales                                    YOY $/SF
                  -29% from last month          Oct +22%    Monthly Sales and Avg $/SF       Dec +4%
                           25              80   Nov -24%                                             $250
                                                Dec even
                    NEW PENDINGS           70
                  -14% from last month     60                                                        $200
                           36              50                                                        $150

                     CLOSED SALES          40                                                        $100
                   -3% from last month     30
                        $205               20                                                        $50
                                           10
                    PRICE PER SQ FT         0                                                        $-
                   -7% from last month
                                               Jan  Feb  Mar  Apr  May  Jun  Jul  Aug  Sep  Oct  Nov  Dec
                      $443K                                    Sales '22  Sales '23  Sales '24
                     AVG SALE PRICE
                  -10% from last month                         $/SF '22  $/SF '23  $/SF '24


                                                 All Price Ranges

                                        Oct '24      Nov '24      Dec '24               YTD
                                                                                   '23      '24  (+/-)
                       Listings Taken                       50                       28                       20                 645                625  -3%
                       New Pendings                       43                       29                       25                 458                479  5%
                       Closed Sales                       33                       37                       36                 437                460  5%
                       Price/SF           $202         $220         $205          $210    $222   6%
                       Avg Price       $470,219     $491,284     $442,713      $460,254  $484,270  5%
                                                     <$300k

                                        Oct '24      Nov '24      Dec '24               YTD
                                                                                   '23      '24  (+/-)
                       Listings Taken                       13                         9                         4                 138                   89  -36%
                       New Pendings                         9                         7                         3                 116                   74  -36%
                       Closed Sales                         5                         3                         9                 110                   68  -38%
                       Price/SF           $191         $172         $196          $179    $190   6%
                                                   $300k-$600k
                                        Oct '24      Nov '24      Dec '24               YTD
                                                                                   '23      '24  (+/-)
                       Listings Taken                       23                       13                       11                 345                348  1%
                       New Pendings                       23                       17                       17                 248                294  19%
                       Closed Sales                       21                       23                       20                 234                282  21%
                       Price/SF           $196         $207         $204          $202    $211   4%
                                                     >$600k
                                                                                        YTD
                                        Oct '24      Nov '24      Dec '24
                                                                                   '23      '24  (+/-)
                       Listings Taken                       14                         6                         5                 162                188  16%
                       New Pendings                       11                         5                         5                   94                111  18%
                       Closed Sales                         7                       11                         7                   93                110  18%
                       Price/SF           $217         $242         $212          $237    $247   4%
                        Data source: Realcomp MLS using Great Lakes Repository Data.


        Copyright 2025, Real Estate One