
Page 15 - Housing Report - January 2025
P. 15
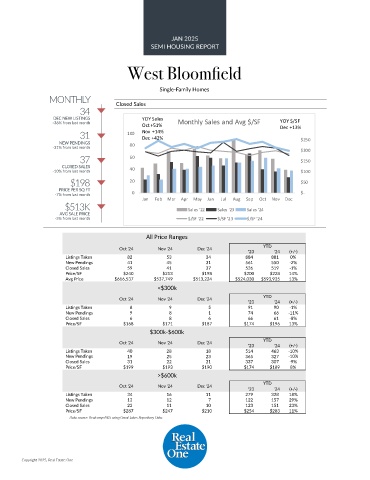
JAN 2025
                                                   SEMI HOUSING REPORT

                                           West Bloomfield


                                                      Single-Family Homes
                 MONTHLY               Closed Sales

                           34
                   DEC NEW LISTINGS             YOY Sales                                     YOY $/SF
                  -36% from last month          Oct +51%    Monthly Sales and Avg $/SF        Dec +13%
                           31              100  Nov +14%
                                                Dec +42%
                     NEW PENDINGS           80                                                       $250
                  -31% from last month
                                                                                                     $200
                           37               60                                                       $150
                      CLOSED SALES          40
                  -10% from last month                                                               $100
                        $198                20                                                       $50
                    PRICE PER SQ FT
                   -7% from last month       0                                                       $-
                                                Jan  Feb  Mar  Apr  May  Jun  Jul  Aug  Sep  Oct  Nov  Dec
                      $513K                                    Sales '22  Sales '23  Sales '24
                     AVG SALE PRICE
                   -5% from last month                         $/SF '22  $/SF '23  $/SF '24

                                                 All Price Ranges

                                         Oct '24     Nov '24      Dec '24               YTD
                                                                                   '23      '24  (+/-)
                       Listings Taken                       82                       53                       34                 884                881  0%
                       New Pendings                       41                       45                       31                 561                550  -2%
                       Closed Sales                       59                       41                       37                 526                519  -1%
                       Price/SF           $240         $213         $198          $200    $228   14%
                       Avg Price       $616,537     $537,749     $513,224      $524,030  $593,935  13%
                                                     <$300k

                                         Oct '24     Nov '24      Dec '24               YTD
                                                                                   '23      '24  (+/-)
                       Listings Taken                         8                         9                         5                   91                   90  -1%
                       New Pendings                         9                         8                         1                   74                   66  -11%
                       Closed Sales                         6                         8                         6                   66                   61  -8%
                       Price/SF           $168         $171         $187          $174    $196   13%
                                                   $300k-$600k
                                         Oct '24     Nov '24      Dec '24               YTD
                                                                                   '23      '24  (+/-)
                       Listings Taken                       40                       28                       18                 514                463  -10%
                       New Pendings                       19                       25                       23                 365                327  -10%
                       Closed Sales                       31                       22                       21                 337                307  -9%
                       Price/SF           $199         $193         $190          $174    $189   8%
                                                     >$600k
                                                                                        YTD
                                         Oct '24     Nov '24      Dec '24
                                                                                   '23      '24  (+/-)
                       Listings Taken                       34                       16                       11                 279                328  18%
                       New Pendings                       13                       12                         7                 122                157  29%
                       Closed Sales                       22                       11                       10                 123                151  23%
                       Price/SF           $287         $247         $210          $254    $283   11%
                        Data source: Realcomp MLS using Great Lakes Repository Data.


        Copyright 2025, Real Estate One