
Page 21 - Housing Report - January 2025
P. 21
JAN 2025
SEMI HOUSING REPORT
Downriver
Single-Family Homes
MONTHLY
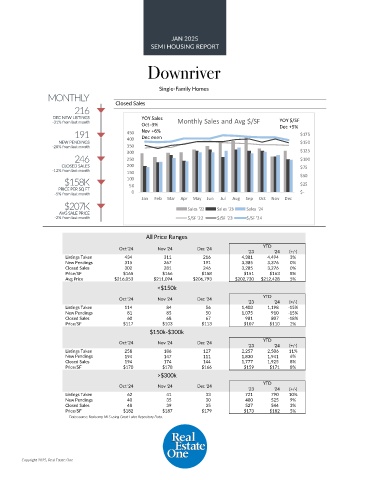
216 Closed Sales
DEC NEW LISTINGS YOY Sales YOY $/SF
-31% from last month Oct -3% Monthly Sales and Avg $/SF Dec +5%
191 450 Nov +6% $175
Dec even
NEW PENDINGS 400 $150
-28% from last month 350
300 $125
246 250 $100
CLOSED SALES 200 $75
-12% from last month 150 $50
$158K 100 $25
PRICE PER SQ FT 50
-5% from last month 0 $-
Jan Feb Mar Apr May Jun Jul Aug Sep Oct Nov Dec
$207K Sales '22 Sales '23 Sales '24
AVG SALE PRICE
-2% from last month $/SF '22 $/SF '23 $/SF '24
All Price Ranges
Oct '24 Nov '24 Dec '24 YTD
'23 '24 (+/-)
Listings Taken 434 311 216 4,381 4,494 3%
New Pendings 315 267 191 3,385 3,376 0%
Closed Sales 302 281 246 3,285 3,276 0%
Price/SF $165 $166 $158 $151 $163 8%
Avg Price $216,053 $211,094 $206,793 $202,730 $212,428 5%
<$150k
Oct '24 Nov '24 Dec '24 YTD
'23 '24 (+/-)
Listings Taken 114 84 56 1,403 1,198 -15%
New Pendings 81 85 50 1,075 910 -15%
Closed Sales 60 68 67 981 807 -18%
Price/SF $117 $103 $113 $107 $110 2%
$150k-$300k
Oct '24 Nov '24 Dec '24 YTD
'23 '24 (+/-)
Listings Taken 258 186 127 2,257 2,506 11%
New Pendings 194 147 111 1,830 1,941 6%
Closed Sales 194 174 144 1,777 1,925 8%
Price/SF $170 $178 $166 $159 $171 8%
>$300k
YTD
Oct '24 Nov '24 Dec '24
'23 '24 (+/-)
Listings Taken 62 41 33 721 790 10%
New Pendings 40 35 30 480 525 9%
Closed Sales 48 39 35 527 544 3%
Price/SF $182 $187 $179 $173 $182 5%
Data source: Realcomp MLS using Great Lakes Repository Data.
Copyright 2025, Real Estate One