
Page 109 - TCL International VILLETA BUSINESS PLAN AND FEASABILITY STUDY
P. 109
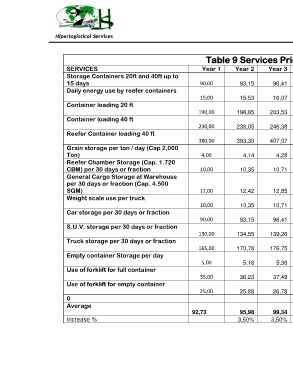
Table 9 Services Price Projection in US$

                             SERVICES                                                Year 1        Year 2        Year 3        Year 4        Year 5        Year 6        Year7         Year 8       Year 9       Year 10
                             Storage Containers 20ft and 40ft up to
                             15 days                                                 90,00           93,15         96,41         99,78       103,28        106,89        110,63        114,51        118,51        122,66
                             Daily energy use by reefer containers
                                                                                     15,00           15,53         16,07         16,63         17,21         17,82         18,44        19,08         19,75         20,44
                             Container loading 20 ft
                                                                                    190,00          196,65        203,53        210,66       218,03        225,66        233,56        241,73        250,19        258,95
                             Container loading 40 ft
                                                                                    230,00          238,05        246,38        255,01       263,93        273,17        282,73        292,62        302,87        313,47
                             Reefer Container loading 40 ft
                                                                                    380,00          393,30        407,07        421,31       436,06        451,32        467,12        483,47        500,39        517,90
                             Grain storage per ton / day (Cap 2,000
                             Ton)                                                    4,00              4,14         4,28          4,43          4,59          4,75          4,92          5,09          5,27         5,45
                             Reefer Chamber Storage (Cap. 1.720
                             CBM) per 30 days or fraction                            10,00           10,35         10,71         11,09         11,48         11,88         12,29        12,72         13,17         13,63
                             General Cargo Storage at Warehouse
                             per 30 days or fraction (Cap. 4.500
                             SQM)                                                    12,00           12,42         12,85         13,30         13,77         14,25         14,75        15,27         15,80         16,35
                             Weight scale use per truck
                                                                                     10,00           10,35         10,71         11,09         11,48         11,88         12,29        12,72         13,17         13,63
                             Car storage per 30 days or fraction
                                                                                     90,00           93,15         96,41         99,78       103,28        106,89        110,63        114,51        118,51        122,66
                             S.U.V. storage per 30 days or fraction
                                                                                    130,00          134,55        139,26        144,13       149,18        154,40        159,80        165,40        171,19        177,18
                             Truck storage per 30 days or fraction
                                                                                    165,00          170,78        176,75        182,94       189,34        195,97        202,83        209,93        217,27        224,88
                             Empty container Storage per day
                                                                                     5,00              5,18         5,36          5,54          5,74          5,94          6,15          6,36          6,58         6,81
                             Use of forklift for full container

                                                                                     35,00           36,23         37,49         38,81         40,16         41,57         43,02        44,53         46,09         47,70
                             Use of forklift for empty container
                                                                                     25,00           25,88         26,78         27,72         28,69         29,69         30,73        31,81         32,92         34,07
                             0
                             Average
                                                                                 92,73               95,98         99,34        102,82       106,41        110,14        113,99        117,98        122,11        126,39
                             Increase %                                                             3,50%         3,50%         3,50%         3,50%         3,50%         3,50%         3,50%         3,50%        3,50%


                                                                                                                                                                                                                     45