
Page 109 - MYM 2015
P. 109
How do individual countries fare in Globalia?
Figure 3 shows the exports for a selected group of larger countries for the ten years 2004-2013. Even under this long-term view China is already number one. Germany comes in as number two, slightly ahead of the US.
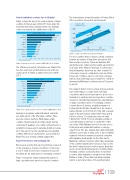
The horizontal axis shows the number of Fortune Global 500 corporations, the vertical axis the exports.
Exports 2013 in billion US-$
2 000 1 500 1 000
China (95)
Germany (28)
USA (128)
Russia (8) Korea (17)
500 France (31)
Japan (57)
0 https://www.destatis.de
Italy (9) United Kingdom (27) Spain (8)
0 50 100 150 Fortune Global 500 Corporations (2013)
China Germany USA Japan France Italy United Kingdom Korea Russia Spain
0 https://www.destatis.de
Country Billion US-$
6 986 5 238
4 566 4 424
4 155 3 814
2 638
13 909 12 592
12 234
2000 4000 6000 8000 10000 12000 14000 16000
Figure 3: Exports for selected countries 2004-2013 in US-$ billion
The differences in export performance are striking. This becomes even more evident when we look at the per capita exports in Figure 4, again for the period 2004- 2013.
Figure 5: Large corporations and export performance
For most countries there is indeed a strong correlation between the number of large rms and exports. But there are two exceptions, China and Germany. And exactly these two outliers are the leading export nations in absolute terms. What do they have in common and what distinguishes them from the other countries? It
is the share of exports contributed by mid-sized rms. 68 percent of Chinese exports come from companies with less than 2000 employees (“Small Fish,” 2009). In Germany the Mittelstand contributes about 70 percent to exports.
This suggests that in order to achieve truly exceptional export performance a country needs both large corporations which are strong in exports, and a broad foundation of small and mid-sized exporters. Countries should not only build their international competitiveness on large corporations alone. For emerging countries
it seems illusory to develop a signi cant number of Fortune Global 500 rms, though this is the dream of many politicians. In 2014 only 29 of the 206 sovereign states in the world had an entry in the Fortune Global 500 list, of those 12 countries had only one entry (“Global 500,” 2014). For most emerging countries it
is and will remain a vain hope to create rms of this size. In the 1980s Malaysia set out to become a force in the global auto market and founded a company called Proton. This auto manufacturer started with high ambitions, but in spite of hiring some of the best British engineers Proton has remained a regional competitor with negligible global weight. On the other hand a Malaysian company, Top Glove, which takes advantage of the countries natural rubber resources, has become the world’s market leader for rubber gloves. Brazil has about a dozen global market leaders of similar stature. Emerging countries seem well advised to build their economic future primarily on strong mid-sized rms. Betting on many of these rms will allow emerging nations to get a fairer share of the rapidly growing
your
mind I109
Country US-$
84 796 79 605
75 347 71 355
57 100 54 578
39 338 26 671
10 372
0 https://www.destatis.de
Germany Korea France Italy United Kingdom Spain Japan USA Russia China
153 936
20.000 40.000 60.000 80.000 100.000 120.000 140.000 160.000 180.000
Figure 4: Per capita exports of selected countries 2004-2013 in US-$
Germany is an extreme outlier with almost double the per capita exports of the other large countries. There
are some obvious questions. What makes certain countries strong in exports and others weak? Can the current export weakness of a country be interpreted as a potential to increase exports, generate growth and create jobs? Can exports become a growth area for emerging countries with low per capita exports, such as India and Brazil? The case of China certainly suggests this.
Export Performance and Company Size
Most people assume that export performance depends on the prevalence of large corporations. Is there also
a role of small and mid-sized companies in exports? And what are the implications for emerging countries?
Figure 5 reveals the relation between the number of large corporations and exports for selected countries.
Hidden Champions Export-Turbo
marketing
