
Page 18 - Market Outlook Q3 2024
P. 18
www.ntda.org
18
U.S. Economic Snapshot
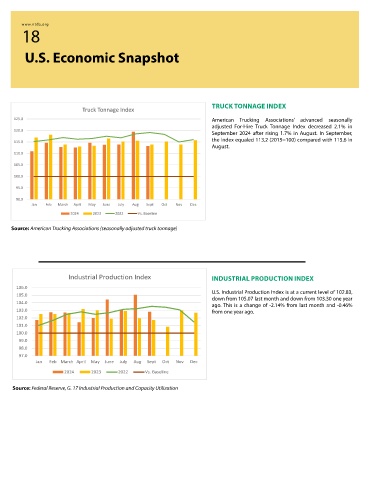
TRUCK TONNAGE INDEX
Truck Tonnage Index
125.0 American Trucking Associations’ advanced seasonally
adjusted For-Hire Truck Tonnage Index decreased 2.1% in
120.0
September 2024 after rising 1.7% in August. In September,
115.0 the index equaled 113.2 (2015=100) compared with 115.6 in
August.
110.0
105.0
100.0
95.0
90.0
Jan Feb March April May June July Aug Sept Oct Nov Dec
2024 2023 2022 Vs. Baseline
Source: American Trucking Associations (seasonally adjusted truck tonnage)
Industrial Production Index INDUSTRIAL PRODUCTION INDEX
106.0
105.0 U.S. Industrial Production Index is at a current level of 102.83,
down from 105.07 last month and down from 103.30 one year
104.0 ago. This is a change of -2.14% from last month and -0.46%
103.0 from one year ago.
102.0
101.0
100.0
99.0
98.0
97.0
Jan Feb March April May June July Aug Sept Oct Nov Dec
2024 2023 2022 Vs. Baseline
Source: Federal Reserve, G. 17 Industrial Production and Capacity Utilization