
Page 20 - Market Outlook Q3 2024
P. 20
www.ntda.org
20
U.S. Economic Snapshot
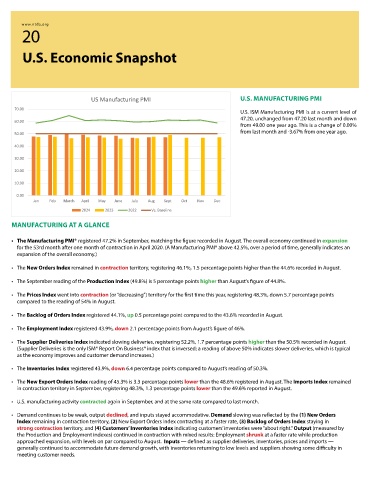
US Manufacturing PMI U.S. MANUFACTURING PMI
70.00
U.S. ISM Manufacturing PMI is at a current level of
47.20, unchanged from 47.20 last month and down
60.00
from 49.00 one year ago. This is a change of 0.00%
50.00 from last month and -3.67% from one year ago.
40.00
30.00
20.00
10.00
0.00
Jan Feb March April May June July Aug Sept Oct Nov Dec
2024 2023 2022 Vs. Baseline
MANUFACTURING AT A GLANCE
• The Manufacturing PMI® registered 47.2% in September, matching the figure recorded in August. The overall economy continued in expansion
for the 53rd month after one month of contraction in April 2020. (A Manufacturing PMI® above 42.5%, over a period of time, generally indicates an
expansion of the overall economy.)
• The New Orders Index remained in contraction territory, registering 46.1%, 1.5 percentage points higher than the 44.6% recorded in August.
• The September reading of the Production Index (49.8%) is 5 percentage points higher than August’s figure of 44.8%.
• The Prices Index went into contraction (or “decreasing”) territory for the first time this year, registering 48.3%, down 5.7 percentage points
compared to the reading of 54% in August.
• The Backlog of Orders Index registered 44.1%, up 0.5 percentage point compared to the 43.6% recorded in August.
• The Employment Index registered 43.9%, down 2.1 percentage points from August’s figure of 46%.
• The Supplier Deliveries Index indicated slowing deliveries, registering 52.2%, 1.7 percentage points higher than the 50.5% recorded in August.
(Supplier Deliveries is the only ISM® Report On Business® index that is inversed; a reading of above 50% indicates slower deliveries, which is typical
as the economy improves and customer demand increases.)
• The Inventories Index registered 43.9%, down 6.4 percentage points compared to August’s reading of 50.3%.
• The New Export Orders Index reading of 45.3% is 3.3 percentage points lower than the 48.6% registered in August. The Imports Index remained
in contraction territory in September, registering 48.3%, 1.3 percentage points lower than the 49.6% reported in August.
• U.S. manufacturing activity contracted again in September, and at the same rate compared to last month.
• Demand continues to be weak, output declined, and inputs stayed accommodative. Demand slowing was reflected by the (1) New Orders
Index remaining in contraction territory, (2) New Export Orders Index contracting at a faster rate, (3) Backlog of Orders Index staying in
strong contraction territory, and (4) Customers’ Inventories Index indicating customers’ inventories were “about right.” Output (measured by
the Production and Employment indexes) continued in contraction with mixed results: Employment shrunk at a faster rate while production
approached expansion, with levels on par compared to August. Inputs — defined as supplier deliveries, inventories, prices and imports —
generally continued to accommodate future demand growth, with inventories returning to low levels and suppliers showing some difficulty in
meeting customer needs.