Page 22 - NTDA Market Outlook Q1 2024
P. 22

www.ntda.org
        22


        U.S. Economic Snapshot


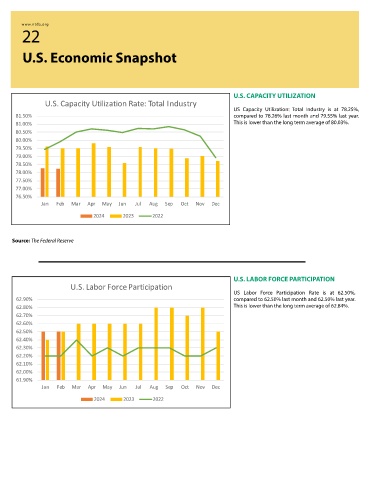
                                                                              U.S. CAPACITY UTILIZATION
                U.S. Capacity Utilization Rate: Total Industry
                                                                              US Capacity Utilization:  Total Industry is at 78.25%,
      81.50%                                                                  compared to 78.26% last month and 79.55% last year.
      81.00%                                                                  This is lower than the long term average of 80.03%.
      80.50%
      80.00%
      79.50%
      79.00%
      78.50%
      78.00%
      77.50%
      77.00%
      76.50%
               Jan  Feb  Mar  Apr  May  Jun   Jul  Aug  Sep  Oct  Nov  Dec

                                2024      2023     2022


     Source: The Federal Reserve


                                                                              U.S. LABOR FORCE PARTICIPATION
                        U.S. Labor Force Participation
                                                                              US Labor Force Participation Rate is at 62.50%,
      62.90%                                                                  compared to 62.50% last month and 62.50% last year.
      62.80%                                                                  This is lower than the long term average of 62.84%.
      62.70%
      62.60%
      62.50%
      62.40%
      62.30%
      62.20%
      62.10%
      62.00%
      61.90%
               Jan  Feb  Mar  Apr  May  Jun   Jul  Aug  Sep  Oct  Nov  Dec

                                2024      2023      2022
   17   18   19   20   21   22   23   24   25   26   27