Page 24 - NTDA Market Outlook Q1 2024
P. 24

www.ntda.org
        24


        U.S. Economic Snapshot


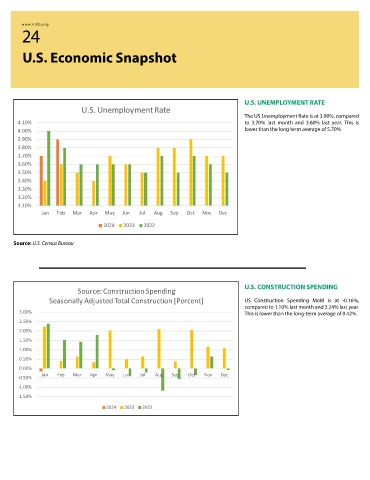
                                                                                  U.S. UNEMPLOYMENT RATE
                            U.S. Unemployment Rate
                                                                                  The US Unemployment Rate is at 3.90%, compared
       4.10%                                                                      to 3.70% last month and 3.60% last year. This is
       4.00%                                                                      lower than the long term average of 5.70%
       3.90%
       3.80%
       3.70%
       3.60%
       3.50%
       3.40%
       3.30%
       3.20%
       3.10%
               Jan  Feb  Mar   Apr  May  Jun   Jul  Aug  Sep   Oct  Nov  Dec

                                   2024   2023   2022


     Source: U.S. Census Bureau


                           Source: Construction Spending                          U.S. CONSTRUCTION SPENDING
                 Seasonally Adjusted Total Construction [Percent]                 US Construction Spending MoM is at -0.16%,
                                                                                  compared to 1.10% last month and 2.24% last year.
       3.00%                                                                      This is lower than the long-term average of 0.42%.
       2.50%
       2.00%
       1.50%
       1.00%
       0.50%
       0.00%
               Jan  Feb  Mar   Apr  May   Jun  Jul  Aug   Sep  Oct   Nov  Dec
       -0.50%
       -1.00%
       -1.50%
                                    2024  2023  2022
   19   20   21   22   23   24   25   26   27   28