Page 14 - SUBHARADEV SEN AND AHMED
P. 14

SEN AND AFIFY


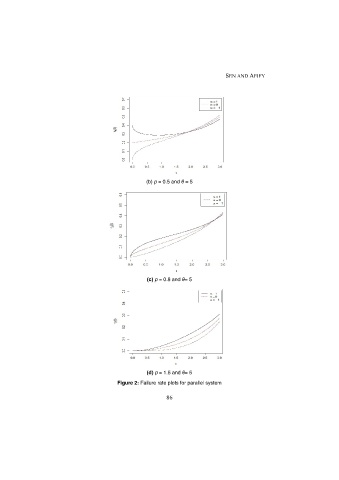
                                                    (b) p = 0.5 and θ = 5


                                                     (c) p = 0.8 and θ= 5


                                                     (d) p = 1.5 and θ= 5

                                          Figure 2: Failure rate plots for parallel system
                                                           86
   9   10   11   12   13   14   15   16