
Page 16 - ZaZa Hospitality- 2021
P. 16
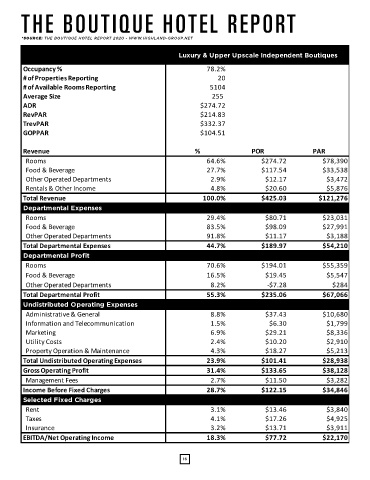
THE BOUTIQUE HOTEL REPORT
*SOURCE: THE BOUTIQUE HOTEL REPORT 2020 - WWW.HIGHLAND-GROUP.NET
The Boutique Hotel Report 2020 Luxury & Upper Upscale Independent Boutiques Hotel ZaZa Dallas Hotel ZaZa Houston Museum District
Occupancy % 78.2% 71.2% 68.0%
# of Properties Reporting 20 1 1
# of Available Rooms Reporting 5104 166 313
Average Size 255 166 313
ADR $274.72 $298.29 $251.38
RevPAR $214.83 $212.38 $170.94
TrevPAR $332.37 $336.59 $335.38
GOPPAR $104.51 $132.63 $114.73
Revenue % POR PAR % POR PAR % POR PAR
Rooms 64.6% $274.72 $78,390 59.0% $278.72 $78,014 51.2% $252.40 $59,090
Food & Beverage 27.7% $117.54 $33,538 35.0% $165.41 $46,298 41.7% $205.73 $48,164
Other Operated Departments 2.9% $12.17 $3,472 3.5% $16.70 $4,675 3.0% $14.61 $3,420
Rentals & Other Income 4.8% $20.60 $5,876 2.5% $11.90 $3,332 4.1% $20.46 $4,789
Total Revenue 100.0% $425.03 $121,276 100.0% $472.74 $132,319 100.0% $493.20 $115,463
Departmental Expenses
Rooms 29.4% $80.71 $23,031 22.0% $61.31 $17,161 22.0% $55.48 $12,988
Food & Beverage 83.5% $98.09 $27,991 61.4% $101.61 $28,441 63.6% $130.80 $30,621
Other Operated Departments 91.8% $11.17 $3,188 57.3% $16.40 $4,591 73.0% $25.58 $5,989
Total Departmental Expenses 44.7% $189.97 $54,210 37.9% $179.32 $50,192 43.0% $211.86 $49,597
Departmental Profit
Rooms 70.6% $194.01 $55,359 78.0% $217.41 $60,853 78.0% $196.93 $46,102
Food & Beverage 16.5% $19.45 $5,547 38.6% $63.80 $17,857 36.4% $74.94 $17,543
Other Operated Departments 8.2% -$7.28 $284 42.7% -$47.10 $84 27.0% -$60.33 -$2,568
Total Departmental Profit 55.3% $235.06 $67,066 62.1% $293.42 $82,126 57.0% $281.35 $65,866
Undistributed Operating Expenses
Administrative & General 8.8% $37.43 $10,680 8.2% $38.71 $10,834 7.5% $36.78 $8,610
Information and Telecommunication 1.5% $6.30 $1,799 2.0% $9.66 $2,702 1.7% $8.60 $2,012
Marketing 6.9% $29.21 $8,336 6.9% $32.53 $9,105 7.0% $34.36 $8,044
Utility Costs 2.4% $10.20 $2,910 1.7% $7.94 $2,222 2.5% $12.13 $2,840
Property Operation & Maintenance 4.3% $18.27 $5,213 3.9% $18.31 $5,126 4.2% $20.76 $4,860
Total Undistributed Operating Expenses 23.9% $101.41 $28,938 22.7% $107.14 $29,988 22.8% $112.62 $26,366
Gross Operating Profit 31.4% $133.65 $38,128 39.4% $186.28 $52,138 34.2% $168.73 $39,500
Management Fees 2.7% $11.50 $3,282 4.4% $20.96 $5,868 3.4% $16.85 $3,946
Income Before Fixed Charges 28.7% $122.15 $34,846 35.0% $165.31 $46,270 30.8% $151.87 $35,555
Selected Fixed Charges
Rent 3.1% $13.46 $3,840 1.1% $5.29 $1,481 0.4% $2.06 $481
Taxes 4.1% $17.26 $4,925 5.2% $24.49 $6,854 4.6% $22.45 $5,257
Insurance 3.2% $13.71 $3,911 1.0% $4.65 $1,303 1.0% $5.12 $1,198
EBITDA/Net Operating Income 18.3% $77.72 $22,170 27.7% $130.88 $36,632 24.8% $122.25 $28,619
16