
Page 53 - Copper and Bronze in Art: Corrosion, Colorants, Getty Museum Conservation, By David Scott
P. 53
Leidheiser (1979) summarizes chemical and physical data, covering a wide range of copper
alloys together with corrosion rates, for seventy National Bureau of Standards test sites across
the United States. The data are for variables of drainage, resistivity, pH, percent air-pore space,
moisture equivalent, volume shrinkage, apparent specific gravity, and water composition in
terms of total acidity, sodium, calcium, potassium, magnesium, carbonate, bicarbonate, chlo
ride, and sulfate. A less extensive British study was also carried out using test conditions simi
lar to those of the NBS program, with results that were broadly comparable. The NBS study
showed losses in wall thickness of copper pipe to be from 0.06 to 5.2 X 10 ~ mm per year; the
2
British study showed from 0.06 to 6.9 X 10 ~ 2 mm per year. Copper and copper alloys were not
found to undergo appreciable pitting, except in moist acid-clay soils and wet acid peat, where
localized attack occurred sporadically.
These conclusions are very useful for the general modeling of the corrosion rates of buried
copper, but for archaeological material buried for thousands of years, the general rate derived
i
from these short-term studies may be inadequate. They illustrate the difficulty n modeling
extremely long-term events by short-term experiment, even on a single-phase substrate. In
archaeological contexts, unalloyed copper usually corrodes much more slowly than tin bronze,
arsenical copper, or brass alloys. An example is provided by some very early copper scraps and
ornaments from an important Greek Neolithic ditched enclosure. The pieces were examined at
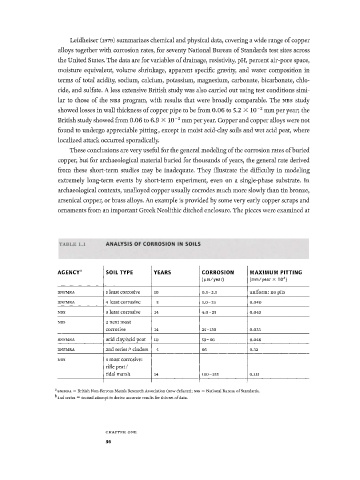
TABLE l . l ANALYSIS OF CORROSION IN SOILS
ACENCY a SOIL TYPE YEARS CORROSION MAXIMUM PITTING
(μιη/year) (mm/year x 10 )
4
BNFMRA 5 least corrosive 10 0.5-2.5 uniform: no pits
BNFMRA 4 least corrosive 5 5.0-25 0.040
NBS 9 least corrosive 14 4.0-25 0.043
NBS 2 next most
corrosive 14 25-130 0.033
BNFMRA acid clay/acid peat 10 53-66 0.046
BNFMRA 2nd series cinders 5 66 0.32
:
b
NBS 3 most corrosive:
rifle peat/
tidal marsh 14 160-355 0.115
A BNFMR A = British Non-Fe >rrous Metals Research Ass •ciation (now defunct); NB 3 = National Bureau of Standards.
^2nd series = second atten ipt to derive accurate resul ts for this set of data.
C H A P T E R O N E
36