
Page 55 - DUOKOPT BIBLIOBOOK
P. 55
EFFICACY
Boyle et al Dorzolamide–Timolol Component Comparison in Washed-out Patients
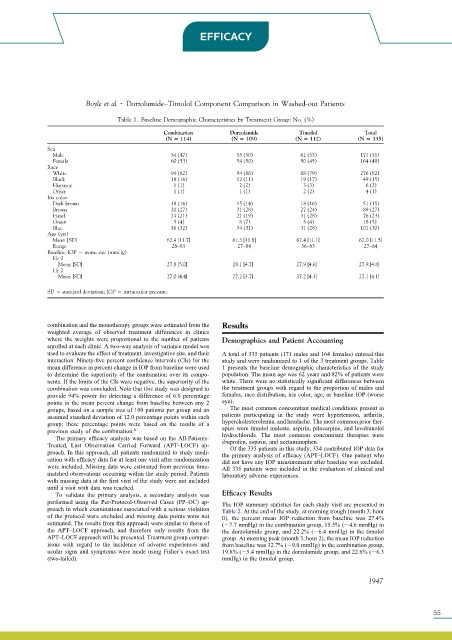
Table 1. Baseline Demographic Characteristics by Treatment Group: No. (%)
Combination Dorzolamide Timolol Total
(N 114) (N 109) (N 112) (N 335)
Sex
Male 54 (47) 55 (50) 62 (55) 171 (51)
Female 60 (53) 54 (50) 50 (45) 164 (49)
Race
White 94 (82) 94 (86) 88 (79) 276 (82)
Black 18 (16) 12 (11) 19 (17) 49 (15)
Hispanic 1 (1) 2 (2) 3 (3) 6 (2)
Other 1 (1) 1 (1) 2 (2) 4 (1)
Iris color
Dark brown 18 (16) 15 (14) 18 (16) 51 (15)
Brown 31 (27) 31 (28) 27 (24) 89 (27)
Hazel 24 (21) 21 (19) 31 (28) 76 (23)
Green 5 (4) 8 (7) 5 (4) 18 (5)
Blue 36 (32) 34 (31) 31 (28) 101 (30)
Age (yrs)
Mean [SD] 62.4 [11.7] 61.3 [11.8] 62.4 [11.1] 62.0 [11.5]
Range 28–83 27–84 36–83 27–84
Baseline IOP worse eye (mmHg)
Hr 0
Mean [SD] 27.8 [5.0] 28.1 [4.7] 27.9 [4.6] 27.9 [4.8]
Hr 2
Mean [SD] 27.0 [4.4] 27.2 [3.7] 27.2 [4.3] 27.1 [4.1]
SD standard deviation; IOP intraocular pressure.
combination and the monotherapy groups were estimated from the Results
weighted average of observed treatment differences in clinics
where the weights were proportional to the number of patients Demographics and Patient Accounting
enrolled at each clinic. A two-way analysis of variance model was
used to evaluate the effect of treatment, investigative site, and their A total of 335 patients (171 males and 164 females) entered this
interaction. Ninety-five percent confidence intervals (CIs) for the study and were randomized to1 of the3 treatment groups. Table
mean difference in percent change in IOP from baseline were used 1 presents the baseline demographic characteristics of the study
to determine the superiority of the combination over its compo- population. The mean age was 62 years and 82% of patients were
nents. If the limits of the CIs were negative, the superiority of the white. There were no statistically significant differences between
combination was concluded. Note that this study was designed to the treatment groups with regard to the proportion of males and
provide 94% power for detecting a difference of 6.0 percentage females, race distribution, iris color, age, or baseline IOP (worse
points in the mean percent change from baseline between any 2 eye).
groups, based on a sample size of 100 patients per group and an The most common concomitant medical conditions present in
assumed standard deviation of 12.0 percentage points within each patients participating in the study were hypertension, arthritis,
group; these percentage points were based on the results of a hypercholesterolemia, and headache. The most common prior ther-
previous study of the combination. 8 apies were timolol maleate, aspirin, pilocarpine, and levobunolol
hydrochloride. The most common concomitant therapies were
The primary efficacy analysis was based on the All-Patients- ibuprofen, aspirin, and acetaminophen.
Treated, Last Observation Carried Forward (APT–LOCF) ap- Of the 335 patients in this study, 334 contributed IOP data for
proach. In this approach, all patients randomized to study medi- the primary analysis of efficacy (APT–LOCF). One patient who
cation with efficacy data for at least one visit after randomization did not have any IOP measurements after baseline was excluded.
were included. Missing data were estimated from previous time- All 335 patients were included in the evaluation of clinical and
matched observations occurring within the study period. Patients laboratory adverse experiences.
with missing data at the first visit of the study were not included
until a visit with data was reached.
To validate the primary analysis, a secondary analysis was Efficacy Results
performed using the Per-Protocol-Observed Cases (PP–OC) ap- The IOP summary statistics for each study visit are presented in
proach in which examinations associated with a serious violation Table 2. At the end of the study, at morning trough (month 3, hour
of the protocol were excluded and missing data points were not 0), the percent mean IOP reduction from baseline was 27.4%
estimated. The results from this approach were similar to those of ( 7.7 mmHg) in the combination group, 15.5% ( 4.6 mmHg) in
the APT–LOCF approach, and therefore only results from the the dorzolamide group, and 22.2% ( 6.4 mmHg) in the timolol
APT–LOCF approach will be presented. Treatment group compar- group. At morning peak (month 3, hour 2), the mean IOP reduction
isons with regard to the incidence of adverse experiences and from baseline was 32.7% ( 9.0 mmHg) in the combination group,
ocular signs and symptoms were made using Fisher’s exact test 19.8% ( 5.4 mmHg) in the dorzolamide group, and 22.6% ( 6.3
(two-tailed). mmHg) in the timolol group.
1947
55