
Page 56 - DUOKOPT BIBLIOBOOK
P. 56
DUOKOPT - bibliography book - CONFIDENTIAL - document for exclusive use by personnel of Laboratoires Théa – DO NOT DISTRIBUTE
®
Ophthalmology Volume 105, Number 10, October 1998
Table 2. Intraocular Pressure (mmHg) Summary Statistics: Mean (Standard Deviation)*
Examination Treatment N Baseline Treatment Change % Change
Hr 0
Wk 2 Combination 113 27.9 (5.0) 19.7 (4.1) 8.1 (4.6) 28.5 (13.3)
Dorzolamide 109 28.1 (4.7) 23.4 (4.4) 4.6 (3.7) 16.1 (11.6)
Timolol 111 27.9 (4.6) 21.5 (3.8) 6.4 (4.0) 22.4 (11.8)
Mo 1 Combination 114 27.8 (5.0) 19.8 (4.3) 8.0 (4.5) 28.2 (13.0)
Dorzolamide 109 28.1 (4.7) 23.1 (4.2) 5.0 (3.8) 17.4 (11.4)
Timolol 111 27.9 (4.6) 20.9 (4.0) 7.0 (3.9) 24.6 (11.7)
Mo 2 Combination 114 27.8 (5.0) 20.1 (4.5) 7.7 (4.2) 27.3 (12.7)
Dorzolamide 109 28.1 (4.7) 23.4 (4.3) 4.7 (3.9) 16.3 (12.0)
Timolol 111 27.9 (4.6) 21.4 (4.6) 6.5 (3.8) 23.2 (12.0)
Mo 3 Combination 114 27.8 (5.0) 20.1 (4.5) 7.7 (4.2) 27.4 (13.1)
Dorzolamide 109 28.1 (4.7) 23.5 (4.2) 4.6 (4.3) 15.5 (13.5)
Timolol 111 27.9 (4.6) 21.5 (4.0) 6.4 (4.1) 22.2 (12.5)
Hr 2
Wk 2 Combination 111 27.1 (4.4) 18.0 (3.5) 9.1 (3.9) 33.1 (11.2)
Dorzolamide 109 27.3 (3.8) 21.3 (3.9) 6.0 (3.1) 21.9 (10.6)
Timolol 110 27.3 (4.4) 20.3 (3.5) 7.0 (4.9) 24.6 (14.5)
Mo 1 Combination 112 27.1 (4.3) 17.8 (3.7) 9.3 (4.4) 33.7 (13.1)
Dorzolamide 109 27.3 (3.8) 21.2 (3.9) 6.1 (3.3) 22.1 (11.0)
Timolol 110 27.3 (4.4) 20.2 (3.9) 7.0 (4.9) 24.8 (15.0)
Mo 2 Combination 112 27.1 (4.3) 17.7 (3.7) 9.4 (4.4) 34.1 (12.6)
Dorzolamide 109 27.3 (3.8) 21.3 (3.8) 5.9 (3.3) 21.5 (10.9)
Timolol 110 27.3 (4.4) 20.7 (4.4) 6.6 (5.2) 23.3 (16.8)
Mo 3 Combination 112 27.1 (4.3) 18.1 (3.8) 9.0 (4.3) 32.7 (12.9)
Dorzolamide 109 27.3 (3.8) 21.8 (4.3) 5.4 (3.6) 19.8 (12.6)
Timolol 110 27.3 (4.4) 21.0 (4.7) 6.3 (4.7) 22.6 (15.6)
SD standard deviation.
* All patients treated analysis (last observation carried forward) worse eye.
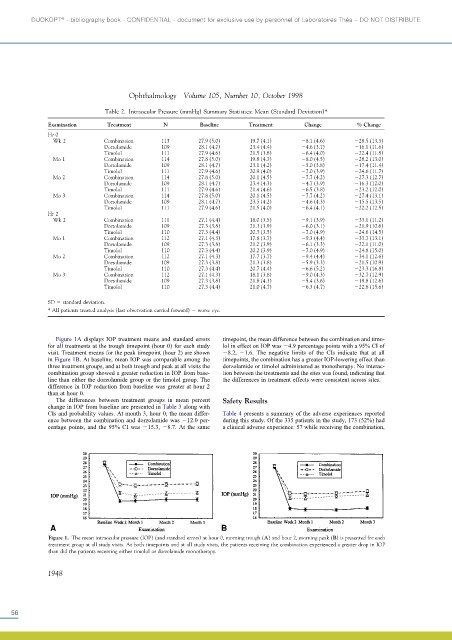
Figure 1A displays IOP treatment means and standard errors timepoint, the mean difference between the combination and timo-
for all treatments at the trough timepoint (hour 0) for each study lol in effect on IOP was 4.9 percentage points with a 95% CI of
visit. Treatment means for the peak timepoint (hour 2) are shown 8.2, 1.6. The negative limits of the CIs indicate that at all
in Figure 1B. At baseline, mean IOP was comparable among the timepoints, the combination has a greater IOP-lowering effect than
three treatment groups, and at both trough and peak at all visits the dorzolamide or timolol administered as monotherapy. No interac-
combination group showed a greater reduction in IOP from base- tion between the treatments and the sites was found, indicating that
line than either the dorzolamide group or the timolol group. The the differences in treatment effects were consistent across sites.
difference in IOP reduction from baseline was greater at hour 2
than at hour 0.
The differences between treatment groups in mean percent Safety Results
change in IOP from baseline are presented in Table3 along with
CIs and probability values. At month 3, hour 0, the mean differ- Table4 presentsa summary of the adverse experiences reported
ence between the combination and dorzolamide was 12.0 per- during this study. Of the 335 patients in the study, 173 (52%) had
centage points, and the 95% CI was 15.3, 8.7. At the same a clinical adverse experience: 57 while receiving the combination,
Figure 1. The mean intraocular pressure (IOP) (and standard errors) at hour 0, morning trough (A) and hour 2, morning peak (B) is presented for each
treatment group at all study visits. At both timepoints and at all study visits, the patients receiving the combination experienced a greater drop in IOP
than did the patients receiving either timolol or dorzolamide monotherapy.
1948
56