
Page 35 - bne IntelliNews Country Report: Russia Dec17
P. 35
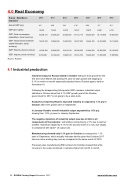
4.0    Real   Economy
Russia   -   Main   Macro Indicators
2010 2011 2012 2013 2014 2015 2016
Annual   GDP   (y/y)
4.5 4.26 3.41 1.34 0.64 -3.7 -0.5
GDP   (per   capita)
10,675 13,324 14,079 15,531 13,873 9,055 8,731
GDP:   Final   consumption expenditure,   (local   currency)
32,096,141 37,208,226 42,205,094 47,163,119 56,336,400 59,116,800 59,822,700
GDP:   Gross   fixed   investment capital   formation,   (local currency)
10,472,700 13,982,500 15,223,900 15,077,000 16,436,100 16,812,800 18,112,400
GDP:   Exports,   (local   currency)
13,529,300 16,940,900 18,413,100 18,936,600 21,464,200 23,606,500 22,124,300
GDP:   Imports,   (local   currency)
9,789,600 12,164,400 13,848,100 15,014,100 16,296,400 17,095,200 17,685,800
Source:   Rosstat
4.1    Industrial   production
Industrial   output   in   Russia   stalled   in   October    failing   to   show   growth   for   the first   time   since   March   and   posting   0%   year-on-year   growth   and   slipping   by 0.1%   in   month-on-month   seasonally   adjusted   terms,   Rosstat   agency   said   on November   16.
Following   the   disappointing   third-quarter   GDP   numbers,   industrial   output statistics   in   October   show   that   2.1%   GDP   growth   goal   of   the   Russian government   for   2017   is   not   going   to   be   a   slam-dunk.
Analysts   surveyed   by   Reuters   expected   industry   to   expand   by   1.1%   y/y   in October    after   0.9%   growth   seen   in   September.
In   January-October   overall   industrial   output   expanded   by   1.6%   y/y , slowing   from   1.8%   y/y   seen   in   January-September.
The   negative   dynamics   of   industrial   output   was   due   to   falls   in   all components   of   the   indicator ,   with   utilities   contracting   by   2.1%   due   to   warmer weather.   Extraction   slipped   by   0.1%   for   the   second   month   in   a   row,   due   largely to   compliance   with   Opec+   oil   output   cuts.
Manufacturing   showed   only   0.1%   gain   in   October    as   compared   to   1.1% seen   in   September,   which   actually   indicates   decline   given   that   October   2017 had   one   more   working   day   more   as   compared   to   the   same   month   of   2016.
Previously   also   manufacturing   PMI   numbers   for   October   showed   that   while recovery   in   the   output   continued,   it   remains   shaky   from   month   to   month.
35       RUSSIA  Country  Report   December    2017                                                                                                                                                                                www.intellinews.com
