
Page 15 - UKRRptJuly18
P. 15
3.0 Macro Economy
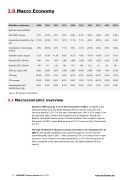
Main Macro indicators 2008 2009 2010 2011 2012 2013 2014 2015 2016 2017e
Business cycle indicators
Real GDP, chg yoy 2.3% -14.8% 4.1% 5.2% 0.2% 0.2% -6.6% -9.8% 2.3% 2.2%
Household consumption, chg 11.8% -14.9% 7.1% 15.7% 11.7% 7.7% -9.6% -20.2% 4.5% 4.0% yoy
Investments in fixed capital, 1.6% -50.5% 3.9% 7.1% 0.9% -6.7% -23.0% -9.3% 6.0% 12.0% chg yoy
Industrial output, chg yoy -5.2% -21.9% 11.2% 8.0% -0.7% -4.3% -10.1% -13.0% 2.1% -0.1%
Nominal GDP, UAH bln 948 913 1,079 1,300 1,405 1,465 1,567 1,979 2,351 2,755
Nominal GDP, USD bln 180 117 136 163 176 183 132 91 93 98
GDP per capita, USD 3,891 2,550 2,972 3,580 3,865 4,030 2,904 1,996 1,991 2,314
CPI (eop) 22.3% 12.3% 9.1% 4.6% -0.2% 0.5% 24.9% 43.3% 12.4% 13.7%
CPI average 25.2% 15.9% 9.4% 8.0% 0.6% -0.3% 12.1% 48.7% 14.9% 14.5%
Unemployment (ILO 6.9% 9.6% 8.9% 8.7% 8.2% 7.8% 9.7% 9.7% 9.7% 9.3% methodology, avg)
Source: SP Advisors, World Bank
3.1 Macroeconomic overview
Ukraine’s GDP grew by 3.1% in the first quarter of 2018 , compared to the same period last year, the State Statistics Service reports. Last year, the economy grew by 2.5%. For this year, estimates are in the 3-3.5% range. Over the last three years, Ukraine has outperformed its neighbors, Russia and Belarus, Oleksandr Kramar writes in Ukrainian Week. One exception was the first quarter of 2018 , when Belarus grew at 5.1%, a six year high. Russia grew at 1.3%.
The size of Ukraine’s shadow economy has fallen to an estimated 31% of GDP as the situation stabilises and companies begin to recover from the pummelling they took in 2015. After contracting 15% in the worst of the recent economic crisis, Ukraine’s economy expanded by 3.1% in the first quarter of 2018, compared to the same period last year, the State Statistics Service reports.
15 UKRAINE Country Report July 2018 www.intellinews.com
