
Page 44 - RusRPTMay21
P. 44
4.0 Real Economy
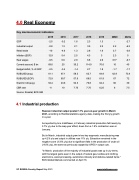
Key macroeconomic indicators
2015 2016 2017 2018 2019 2M20 2020e
GDP -2.5 -0.2 1.6 2.3 1.3 - -2.7
Industrial output -0.8 1.3 2.1 3.5 2.3 2.2 -6.3
Retail trade -10 -4.6 1.3 2.8 1.6 3.7 -3.8
Inflation (EOP) 12.9 5.4 2.5 4.3 3 2.3 5
Real wages -9.5 0.6 2.9 6.8 2.9 6.5* -6.7
Current account, $ bn 69.6 25 35.2 114.9 70.6 16 45
Budget deficit, % of GDP -2.5 -3.4 -1.4 2.7 1.8 -1.7 -1.7
RUB/USD (avg) 61.1 67.1 58.3 62.7 64.8 62.9 73.4
RUB/USD (EOP) 72.9 60.7 57.6 69.5 61.9 67 72
Brent $ / bbl (avg) 52.4 43.6 54.3 70.8 64.4 60 39
CBR rate 11 10 7.75 7.75 6.25 6 7.5 Source: Rosstat, BCS GM
4.1 Industrial production
Russian industrial output posted 1.1% year-on-year growth in March 2021, according to RosStat statistics agency data, making the first y/y growth in a year.
As reported by bne IntelliNews, in February industrial production fell heavily by 3.7% y/y due to the leap year affect, down from a 1.9% contraction seen in January.
But in March, industrial output grew in two key segments: manufacturing was up 4.2% y/y and output in utilities rose 11% y/y. Extraction remained in the negative zone (-5.6% y/y) due to significant falls in the production of crude oil (-9.5% y/y), the same as previously capped by OPEC+ output cuts.
"In March, production of the majority of industrial goods was up in y/y terms, with the largest gains seen in the output of natural gas, textiles and clothing, electronics, wood-processing, automotive industry and defence-related items," BCS Global Markets commented on April 16.
44 RUSSIA Country Report May 2021 www.intellinews.com
