
Page 42 - RusRPTNov18
P. 42
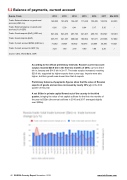
5.2   Balance of payments, current account
Russia -Trade 2012 2013 2014 2015 2016 2017 Mar-2018
Trade: External balance on goods and services (USD mn)
148,023 123,679 134,497 111,638 103,425 130,314 48,353
Trade: External balance on goods and services (% of GDP)
6.66 5.39 6.41 8.04 5.17 5.35 /
Trade: Goods exports (BoP) (USD mn)
527,434 523,275 497,763 341,467 285,772 353,547 101,881
Trade: Goods imports (BoP)
335,771 341,337 308,026 193,952 191,671 237,993 57,000
Trade: Current account BPM6 (USD mn)
71,282 34,801 58,432 68,375 25,664 35,350 18,321
Trade: Current account to GDP (%)
3.20 1.40 2.70 4.90 1.90 2.20 /
source: CEIC, World Bank, CBR
According to the official preliminary estimate, Russia's current account surplus reached $20.8 bln in the first two months of 2018,   up from $12.8 bln in January and $14.5 bln in 2m17. The trade surplus increased, reaching $29.6 bln, supported by higher exports than a year ago. Imports were also higher, but their growth was slower than that of exports.
Preliminary balance-of-payments figures show that the value of Russian exports of goods and services increased by nearly 30% y/y   in the third quarter of this year.
A net $19bn in private capital flowed out of the country in the third quarter,   bringing the value of net capital outflows for the first nine months of the year to $32bn (the annual outflows in 2016 and 2017 averaged slightly over $20bn).
42  RUSSIA Country Report   November 2018    www.intellinews.com
