
Page 28 - TURKRptFeb22
P. 28
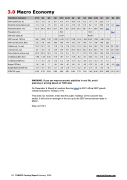
        3.0 Macro Economy
                  Main Macro Indicators
Q1-19
Q2
Q3
Q4
2019
Q1-20
Q2
Q3
Q4
2020
Q1-20
Q2
Q3
Q4
2021
GDP Growth (y/y, %)
-2.5
-1.6
1.0
6.0
0.9
4.4
-10.4
6.3
6.2
1.8
7.4
22.0
7.4
-
-
Electricity Consumption (y/y)
-1.5
0.4
-1.5
0.5
-0.6
3.3
-11.5
3.6
4.5
0.2
5.7
25.8
11.6
9.1
12.4
Employed (active, mn)
27.0
26.9
26.9
26.7
26.7
25.1
20.8
25.2
25.1
24.1
25.8
26.6
27.1
-
-
Population (mn)
-
-
-
-
83.2
-
-
-
-
83.6
-
-
-
84.7
-
GDP (per capita, $)
-
-
-
-
9,127
-
-
-
-
8,599
-
-
-
-
-
GDP (current, TRYbn)
926
1,030
1,157
1,205
4,318
1,071
1,038
1,414
1,524
5,047
1,393
1,586
1,915
-
-
GDP (current prices, $bn)
172
176
204
208
760
176
153
197
192
717
189
189
225
-
-
Inflation (y/y, %, eop)
19.7
15.7
9.3
11.8
11.8
11.9
12.6
11.8
14.6
14.6
16.2
17.5
19.6
36.1
36.1
Lira-loans (%, y/y)
3.0
-0.5
4.0
13.9
13.9
19.1
39.4
46.4
43.3
43.3
34.4
17.5
13.7
20.4
20.4
Policy Rate (%, active, eop)
25.5
23.9
16.3
11.4
11.4
9.3
7.6
11.1
17.0
17.0
19.0
19.0
18.0
14.0
14.0
CA Balance ($bn, Nov)
-1.88
-1.29
5.92
-1.07
1.67
-8.1
-11.9
-8.3
-6.7
-35.5
-7.5
-6.0
2.2
0.5
-
CA Balance/GDP (%)
-1.1
-0.7
2.9
-0.5
0.2
-4.6
-7.8
-4.2
-3.5
-5.0
-4.0
-3.1
1.0
-
Budget (TRYbn)
-36
-42
-7
-38
-124
-30
-80
-31
-32
-173
23
-55
-29
-131
-192
Budget Balance/GDP (%)
-3.9
-4.1
-0.6
-3.1
-2.9
-2.8
-7.7
-2.2
-2.1
-3.4
1.6
-3.5
-1.5
-
-
USD/TRY (eop)
5.56 5.79 5.65 5.95 5.95 6.61 6.85 7.72 7.44 7.44
8.24
8.70
8.89
13.3
13.3
                                    WARNING: If you use macroeconomic statistics in real life, avoid planning or pricing based on TUIK data.
On December 8, Moody’s Investors Service hiked its 2021 official GDP growth release forecast for Turkey to 11%.
This does not, however, mean that the public “bidding” on the outcome has ended. It will come on stronger in the run-up to the GDP announcement date in March.
Why not 15%?
 28 TURKEY Country Report February 2022 www.intellinews.com
