
Page 19 - UKRRptApr19
P. 19
4.0 Real Economy
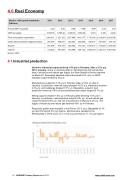
Ukraine - GDP growth breakdown 2011 2012 2013 2014 2015 2016 2017 (UAH mn)
Annual GDP y/y growth
5.20
0.20
0.00
-6.80
-9.90
2.30
2.18
GDP per capita
3,569.76
3,855.42
4,029.72
3,082.46
2,125
2,186
2,640
Final consumption expenditure
1,094,231
1,221,163
1,337,048
1,410,177
1,715,636
2,018,854
2,592,546
Gross fixed investment capital formation
291,678
305,031
262,257
220,563
262,917
361,030
474,133
Exports
647,608
670,319
629,392
770,121
1,044,541
1,174,625
1,430,790
Imports
733,526
791,844
763,499
834,133
1,084,016
1,323,127
1,607,035
Source: CEIC
4.1 Industrial production
Ukraine's industrial output declined 1.8% y/y in February, after a 3.3% y/y fall in January , due to a continuing slide in manufacturing and a production drop in electricity and natural gas supply, the State Statistics Service reported on March 22. Seasonally adjusted output decreased 0.6% m/m. In 2M19, industrial output declined 2.5% y/y.
Manufacturing output fell 1.5% y/y in February (after a 5.5% y/y drop in January). In particular, chemical output plunged 19.5% y/y, machinery declined 4.3% y/y, and metallurgy dropped 3.7% y/y. Meanwhile, output in food production inched up 0.6% y/y and pharmaceutical output surged 23.1% y/y.
Mining output increased 1.6% y/y in February (after declining 1.6% y/y in January). In particular, coal production jumped 9.0% y/y, oil and natural gas output increased 5.6% y/y, and iron ore production inched up 0.2% y/y. The supply of electricity and natural gas declined 4.9% y/y in February.
Regionally, growth was strongest in the Rivne (12.1% y/y), Zakarpattia (9.1% y/y) and Ternopil (8.5% y/y) regions. Declines were steepest in the Khmelnytskiy (-19.8% y/y), Lviv (-11.6% y/y) and Sumy (-11.1% y/y) regions.
19 UKRAINE Country Report April 2019 www.intellinews.com
