
Page 25 - RusRPTDec19
P. 25
than the below 0.5% pace of January-October. Like in the third quarter, the volume of goods transported fell slightly in October, but still diverged sharply from the strong growth seen in previous years and in the first half of this year.
Growth in fixed investment improved slightly in the third quarter, but was still below 1% y/y. Growth was just 0.7% y/y in the first nine months of 2019.
Retail sales growth recovered from its slow pace late this summer to over 1.5% y/y in October, the pace for the January-October period. Growth in real household incomes strengthened in the third quarter. Consumer credit continued to support the recovery in consumption, even if that credit support impulse has been lower than in 2018. The growth of consumer borrowing flow has been lower this year than in previous years, even if it still outpaced inflation.
The economic performance has been improving in 2H19. In 3Q19, this was driven mainly by agriculture, while exports also improved and construction picked up. Budget expenditures, which had been lagging, also started to post double-digit growth. We expect GDP to grow 1.3% this year and 2.0% in 2020.
Growth picks up in 3Q19. Basic sector output was up 2.6% y/y, compared with 1.8% growth in 1H19. The main drivers of this acceleration were agriculture and wholesale trade, which expanded 5.1% y/y (from 1.2% in 1H19) and 3.8% (after a decline of 4% in 1H19). It seems that rising agricultural output in the summer and autumn has led to higher storage and increased wholesale sales.
Goods exports jump in July-August. Their real growth was 5.7% y/y, versus a 0.3% decrease in 1H19. Metals, food, chemicals and transport made the biggest contributions.
Budget spending to drive construction and investment in 4Q19. Expenditures grew 15.9% y/y in 3Q19, the growth soaring from just 1.3% in 1H19. We think this has already started boosting construction. With financing for the so-called "national projects" to be ramped up, we expect the effect to be even stronger in 4Q19.
Regulatory reform continues. The government has organized 41 working groups, made up mostly of representatives of the business community, to either update or abolish regulations across all spheres of business activity.
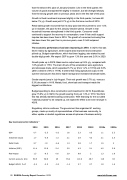
Key macroeconomic indicators "
2014 2015 2016 2017
2018 5M19
2.3 0.5 2.9 4.3 2.8 1.7 4.3 5.1 6.8 2 114.9 48.7 2.7 2.7
2019e 2020e
1.1 2.3 2.1 2.5 1.5 2 4.2 3.8 1.3 1.8 118 93 1.9 1.6
GDP
Industrial output Retail trade
Inflation (EOP)
Real wages
Current account, $ bn Budget deficit, % of
0.7 -2.5 -0.2 1.6 1.7 -0.8 1.3 2.1 2.7 -10 -4.6 1.3
11.4 12.9 5.4 2.5 1.3 -9.5 0.6 2.9 59.5 69.6 25 35.2 -0.4 -2.5 -3.4 -1.4
25 RUSSIA Country Report December 2019
www.intellinews.com
